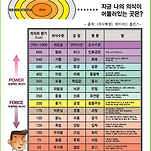
<div class="figure-img" data-ke-type="image" data-ke-style="alignCenter" data-ke-mobilestyle="widthOrigin"><img src="https://t1.daumcdn.net/cafeattach/z4ZG/c0b2ba397b3ed81c63c28a5416fa859b76017499" class="txc-image" width="567" height="377" data-img-src="https://t1.daumcdn.net/cafeattach/z4ZG/c0b2ba397b3ed81c63c28a5416fa859b76017499" data-origin-width="648" data-origin-height="431"></div><p style="text-align: center;"><span style="color: #006dd7;" data-ke-size="size20"><b>위 30cm : 통과시간 3~6 시간 </b></span></p><p style="text-align: center;"><span style="color: #006dd7;" data-ke-size="size20"><b>소장(십이지장25cm, 공장<span style="background-color: #ffffff;">1m, </span>회장2m)  <span style="color: #ee2323;">총 3m : 통과시간 3~10 시간</span></b></span></p><p style="text-align: center;"><span style="color: #006dd7;" data-ke-size="size20"><b>대장 1.5m : 통과시간 2~63시간</b></span></p><p style="text-align: center;"><span style="color: #006dd7;" data-ke-size="size20"><b>전체 통과시간 : 12~72시간</b></span></p><p> </p><p> </p><ol style="list-style-type: decimal;" data-ke-list-type="decimal"><li><a style="color: #666666;" href="https://www.nature.com/" target="_top" class="ke-link">nature</a>  </li><li><a style="color: #666666;" href="https://www.nature.com/nmicrobiol" target="_top" class="ke-link">nature microbiology</a>  </li><li><a style="color: #666666;" href="https://www.nature.com/nmicrobiol/articles?type=article" target="_top" class="ke-link">articles</a>  </li><li>article</li></ol><p><span style="color: #ee2323;" data-ke-size="size20"><b>Gut physiology and environment explain variations in human gut microbiome composition and metabolism</b></span></p><p><a style="color: #ffffff; background-color: #006699;" href="https://www.nature.com/articles/s41564-024-01856-x.pdf" target="_top" class="ke-link">Download PDF</a></p><ul style="list-style-type: disc;" data-ke-list-type="disc"><li>Article</li><li><a style="color: #b74616;" href="https://www.springernature.com/gp/open-science/about/the-fundamentals-of-open-access-and-open-research" target="_top" class="ke-link">Open access</a></li><li>Published: 27 November 2024</li></ul><p>Gut physiology and environment explain variations in human gut microbiome composition and metabolism</p><ul style="list-style-type: disc;" data-ke-list-type="disc"><li><a style="color: #006699;" href="https://www.nature.com/articles/s41564-024-01856-x#auth-Nicola-Proch_zkov_-Aff1" target="_top" class="ke-link">Nicola Procházková</a>, </li><li><a style="color: #006699;" href="https://www.nature.com/articles/s41564-024-01856-x#auth-Martin_F_-Laursen-Aff2" target="_top" class="ke-link">Martin F. Laursen</a>, </li><li><a style="color: #006699;" href="https://www.nature.com/articles/s41564-024-01856-x#auth-Giorgia-La_Barbera-Aff1" target="_top" class="ke-link">Giorgia La Barbera</a>, </li><li><a style="color: #006699;" href="https://www.nature.com/articles/s41564-024-01856-x#auth-Eirini-Tsekitsidi-Aff3" target="_top" class="ke-link">Eirini Tsekitsidi</a>, </li><li><a style="color: #006699;" href="https://www.nature.com/articles/s41564-024-01856-x#auth-Malte_S_-J_rgensen-Aff1" target="_top" class="ke-link">Malte S. Jørgensen</a>, </li><li><a style="color: #006699;" href="https://www.nature.com/articles/s41564-024-01856-x#auth-Morten_A_-Rasmussen-Aff4-Aff5" target="_top" class="ke-link">Morten A. Rasmussen</a>, </li><li><a style="color: #006699;" href="https://www.nature.com/articles/s41564-024-01856-x#auth-Jeroen-Raes-Aff6-Aff7" target="_top" class="ke-link">Jeroen Raes</a>, </li><li><a style="color: #006699;" href="https://www.nature.com/articles/s41564-024-01856-x#auth-Tine_R_-Licht-Aff2" target="_top" class="ke-link">Tine R. Licht</a>, </li><li><a style="color: #006699;" href="https://www.nature.com/articles/s41564-024-01856-x#auth-Lars_O_-Dragsted-Aff1" target="_top" class="ke-link">Lars O. Dragsted</a> & </li><li><a style="color: #006699;" href="https://www.nature.com/articles/s41564-024-01856-x#auth-Henrik_M_-Roager-Aff1" target="_top" class="ke-link">Henrik M. Roager</a> </li></ul><p><a style="color: #006699;" href="https://www.nature.com/nmicrobiol" target="_top" class="ke-link"><i>Nature Microbiology</i></a> <b>volume 9</b>, pages3210–3225 (2024)<a style="color: #006699;" href="https://www.nature.com/articles/s41564-024-01856-x#citeas" target="_top" class="ke-link">Cite this article</a></p><ul style="list-style-type: disc;" data-ke-list-type="disc"><li> </li><li> </li><li> </li><li> </li></ul><p>Abstract</p><p><span style="color: #ee2323;"><b>The human gut microbiome is highly personal</b></span>. However, the contribution of gut physiology and environment to variations in the gut microbiome remains understudied. Here we performed an observational trial using multi-omics to profile microbiome composition and metabolism in 61 healthy adults for 9 consecutive days. We assessed day-to-day changes in gut environmental factors and measured whole-gut and segmental intestinal transit time and pH using a wireless motility capsule in a subset of 50 individuals. We observed substantial daily fluctuations, with intra-individual variations in gut microbiome and metabolism associated with changes in stool moisture and faecal pH, and inter-individual variations accounted for by whole-gut and segmental transit times and pH. Metabolites derived from microbial carbohydrate fermentation correlated negatively with the gut passage time and pH, while proteolytic metabolites and breath methane showed a positive correlation. Finally, we identified associations between segmental transit time/pH and coffee-, diet-, host- and microbial-derived metabolites. Our work suggests that gut physiology and environment are key to understanding the individuality of the human gut microbial composition and metabolism.</p><p> </p><p><b>초록</b></p><p> </p><p><span style="color: #ee2323;"><b>인간 장내 미생물 군집은 </b></span></p><p><span style="color: #ee2323;"><b>매우 개인적입니다. </b></span></p><p> </p><p><span style="color: #ee2323;"><b>그러나 </b></span></p><p><span style="color: #ee2323;"><b>장내 미생물 군집의 변이에 대한 장 생리학 및 환경의 기여도는 </b></span></p><p><span style="color: #ee2323;"><b>여전히 충분히 연구되지 않았습니다. </b></span></p><p> </p><p><span style="color: #006dd7;"><b>본 연구에서는 <span data-ke-size="size18">61명의 건강한 성인을 대상으로 </span></b></span></p><p><span style="color: #006dd7;" data-ke-size="size18"><b>9일 연속 관찰 시험을 수행하여 </b></span></p><p><span style="color: #006dd7;"><b><span data-ke-size="size18">다중 오믹스 기술을 활용해 미생물 군집 구성과 대사 프로파일을 분석</span>했습니다. </b></span></p><p> </p><p><span style="color: #ee2323;" data-ke-size="size18"><b>50명의 하위 집단에서 무선 운동성 캡슐을 사용하여 </b></span></p><p><span style="color: #ee2323;" data-ke-size="size18"><b>장 환경 요인의 일일 변화를 평가하고, </b></span></p><p><span style="color: #ee2323;"><b><span data-ke-size="size18">전체 장 및 분절별 장 통과 시간과 pH를 측정</span>하였다. </b></span></p><p> </p><p><span style="color: #006dd7;"><b>상당한 일일 변동성을 관찰했으며, </b></span></p><p><span style="color: #006dd7;"><b>장내 미생물군집과 대사 활동의 개인 내 변동은 </b></span></p><p><span style="color: #006dd7;"><b>대변 수분 함량 및 분변 pH 변화와 연관되었고, </b></span></p><p><span style="color: #006dd7;"><b>개인 간 변동은 전체 장 및 분절별 통과 시간과 pH에 의해 설명되었다. </b></span></p><p> </p><p><span style="color: #ee2323;" data-ke-size="size20"><b>미생물 탄수화물 발효에서 유래한 대사산물은 </b></span></p><p><span style="color: #ee2323;"><b><span data-ke-size="size20">장 통과 시간 및 pH와 음의 상관관계</span>를 보인 반면, </b></span></p><p><span style="color: #ee2323;"><b>단백질 분해 대사산물과 호흡 메탄은 양의 상관관계를 나타냈다. </b></span></p><p> </p><p><span style="color: #006dd7;"><b>마지막으로, </b></span></p><p><span style="color: #006dd7;"><b>분절별 통과 시간/pH와 커피, 식이, 숙주 및</b></span></p><p><span style="color: #006dd7;"><b> <span data-ke-size="size20">미생물 유래 대사산물 간의 연관성을 확인</span>했다. </b></span></p><p> </p><p><span style="color: #ee2323;"><b>본 연구는 </b></span></p><p><span style="color: #ee2323;" data-ke-size="size18"><b>장 생리학 및 환경이 </b></span></p><p><span style="color: #ee2323;"><b><span data-ke-size="size18">인간 장내 미생물 구성과 대사의 개체차를 이해하는 핵심 요소</span>임을 시사한다</b></span>.</p><p> </p><p>Similar content being viewed by others</p><div class="figure-img" data-ke-type="image" data-ke-style="alignCenter" data-ke-mobilestyle="widthOrigin"><img src="https://t1.daumcdn.net/cafeattach/z4ZG/1d8d624f6da3037c1f3cca178f847927129e8c40" class="txc-image" data-img-src="https://t1.daumcdn.net/cafeattach/z4ZG/1d8d624f6da3037c1f3cca178f847927129e8c40" data-origin-width="215" data-origin-height="120"></div><p><a style="color: #000000;" href="https://www.nature.com/articles/s41575-025-01092-6?fromPaywallRec=false" target="_top" class="ke-link">Intestinal pH: a major driver of human gut microbiota composition and metabolism</a></p><p>Article 02 July 2025</p><p> </p><div class="figure-img" data-ke-type="image" data-ke-style="alignCenter" data-ke-mobilestyle="widthOrigin"><img src="https://t1.daumcdn.net/cafeattach/z4ZG/df4504be6577b7aba9d4f5ce71c987579355edf4" class="txc-image" data-img-src="https://t1.daumcdn.net/cafeattach/z4ZG/df4504be6577b7aba9d4f5ce71c987579355edf4" data-origin-width="971" data-origin-height="292"><div class="figcaption">초록 인간의 위장관에서 pH는 장내 미생물 구성과 활동을 형성하는 핵심 요소인 동시에 미생물 대사에 의해 영향을 받는다. pH는 숙주, 식이, 미생물 및 외부 요인의 복합적 작용으로 인해 개인 내 위장관 구간별로, 그리고 개인 간에 상당한 차이를 보인다. 지난 세기 동안 미생물군집 구성과 대사 반응에 대한 pH의 중요성은 광범위하게 연구되어 왔다. 본고에서는 위장관 내 pH에 영향을 미치는 주요 생리적 및 식이적 요인을 탐구하기 위해 문헌을 검토한다. 미생물 생태학적 관점에서 위장관 pH가 미생물군집 구성과 대사에 미치는 영향을 논의한다. pH가 세균의 산 반응 시스템, 유전자 발현 및 건강에 중요한 미생물 대사산물 생성에 영향을 미치는 메커니즘을 탐구한다. 마지막으로, 위장관 pH가 인간 질환에서 수행할 수 있는 잠재적 역할에 관한 문헌을 검토한다. 위장관 pH를 고려함으로써 건강 및 질병 상태에서의 장내 미생물군집에 대한 이해를 심화할 수 있다고 제안한다. pH에 의해 매개되는 장내 미생물 대사 변이가 인간 건강과 관련된 대사 산출물을 예측하고 조절하는 데 매우 중요하다고 주장한다.</div></div><div class="figure-img" data-ke-type="image" data-ke-style="alignCenter" data-ke-mobilestyle="widthOrigin"><img src="https://t1.daumcdn.net/cafeattach/z4ZG/953c8ad99d77b12166f3bff485da57ce45d3bf06" class="txc-image" data-img-src="https://t1.daumcdn.net/cafeattach/z4ZG/953c8ad99d77b12166f3bff485da57ce45d3bf06" data-origin-width="216" data-origin-height="120"></div><p><a style="color: #000000;" href="https://www.nature.com/articles/s41467-021-27098-7?fromPaywallRec=false" target="_top" class="ke-link">Temporal variability in quantitative human gut microbiome profiles and implications for clinical research</a></p><p> </p><p>Article Open access18 November 2021</p><div class="figure-img" data-ke-type="image" data-ke-style="alignCenter" data-ke-mobilestyle="widthOrigin"><img src="https://t1.daumcdn.net/cafeattach/z4ZG/6e9e1a76108c4bf105c2c66117f6551fc34fc862" class="txc-image" data-img-src="https://t1.daumcdn.net/cafeattach/z4ZG/6e9e1a76108c4bf105c2c66117f6551fc34fc862" data-origin-width="215" data-origin-height="120"></div><p><a style="color: #000000;" href="https://www.nature.com/articles/s41522-024-00526-4?fromPaywallRec=false" target="_top" class="ke-link">Metaproteomic portrait of the healthy human gut microbiota</a></p><p>Article Open access28 June 2024</p><p> </p><p>Main</p><p>Diet influences the gut microbial composition and metabolism<a style="color: #006699;" href="https://www.nature.com/articles/s41564-024-01856-x#ref-CR1" target="_top" class="ke-link">1</a>,<a style="color: #006699;" href="https://www.nature.com/articles/s41564-024-01856-x#ref-CR2" target="_top" class="ke-link">2</a>. However, even with identical dietary intake, the gut microbiome varies<a style="color: #006699;" href="https://www.nature.com/articles/s41564-024-01856-x#ref-CR3" target="_top" class="ke-link">3</a>,<a style="color: #006699;" href="https://www.nature.com/articles/s41564-024-01856-x#ref-CR4" target="_top" class="ke-link">4</a>, suggesting that other factors in the gut contribute to these variations. Gut transit time accounts for substantial variation in the microbiome composition of healthy populations<a style="color: #006699;" href="https://www.nature.com/articles/s41564-024-01856-x#ref-CR5" target="_top" class="ke-link">5</a>,<a style="color: #006699;" href="https://www.nature.com/articles/s41564-024-01856-x#ref-CR6" target="_top" class="ke-link">6</a>,<a style="color: #006699;" href="https://www.nature.com/articles/s41564-024-01856-x#ref-CR7" target="_top" class="ke-link">7</a>,<a style="color: #006699;" href="https://www.nature.com/articles/s41564-024-01856-x#ref-CR8" target="_top" class="ke-link">8</a>, with longer transit time associated with increased microbial protein degradation and methane production<a style="color: #006699;" href="https://www.nature.com/articles/s41564-024-01856-x#ref-CR9" target="_top" class="ke-link">9</a>. While short-chain fatty acids (SCFAs), the main microbial products of saccharolysis, are typically considered beneficial<a style="color: #006699;" href="https://www.nature.com/articles/s41564-024-01856-x#ref-CR10" target="_top" class="ke-link">10</a>, microbial proteolysis results in metabolites associated with poor health outcomes, including hydrogen sulfide, ammonia, branched-chain fatty acids (BCFAs), <i>p</i>-cresol, indole and phenylacetate<a style="color: #006699;" href="https://www.nature.com/articles/s41564-024-01856-x#ref-CR11" target="_top" class="ke-link">11</a>,<a style="color: #006699;" href="https://www.nature.com/articles/s41564-024-01856-x#ref-CR12" target="_top" class="ke-link">12</a>.</p><p>Changes in pH along the gut are also linked to gut microbial composition and metabolism<a style="color: #006699;" href="https://www.nature.com/articles/s41564-024-01856-x#ref-CR13" target="_top" class="ke-link">13</a>. The presence of SCFAs and other organic acids lowers colonic pH<a style="color: #006699;" href="https://www.nature.com/articles/s41564-024-01856-x#ref-CR13" target="_top" class="ke-link">13</a>, inhibiting bacteria sensitive to acidic environments<a style="color: #006699;" href="https://www.nature.com/articles/s41564-024-01856-x#ref-CR14" target="_top" class="ke-link">14</a>. Yet, little is known about how the gut environment, determined by physiological factors such as transit time and luminal pH, associates with diet–host–microbiota metabolism. Understanding these factors could be crucial for future personalized dietary microbiome-based strategies.</p><p>Transit time can be assessed using wireless motility capsules (SmartPills), which measure intraluminal pH, temperature and pressure along the gastrointestinal tract that allow for the determination of segmental transit times. SmartPills are one of the standard clinical methods for directly assessing transit time, along with radio-opaque markers and scintigraphy<a style="color: #006699;" href="https://www.nature.com/articles/s41564-024-01856-x#ref-CR15" target="_top" class="ke-link">15</a>, and have been used in previous microbiome studies<a style="color: #006699;" href="https://www.nature.com/articles/s41564-024-01856-x#ref-CR16" target="_top" class="ke-link">16</a>,<a style="color: #006699;" href="https://www.nature.com/articles/s41564-024-01856-x#ref-CR17" target="_top" class="ke-link">17</a>.</p><p>In this Article, we conducted a 9 day observational study with 61 healthy volunteers and assessed whole-gut and segmental transit time and pH by SmartPills. We also collected data on bowel habits, dietary intake, and breath hydrogen and methane levels and profiled urine and faecal samples using multi-omics techniques. This allowed us to follow and link inter-individual and day-to-day changes in the gut environment, gut microbiota and microbiota-derived metabolites.</p><p> </p><p><b>메인</b></p><p> </p><p><span style="color: #ee2323;" data-ke-size="size18"><b>식이요법은 </b></span></p><p><span style="color: #ee2323;"><b><span data-ke-size="size18">장내 미생물군집 구성과 대사에 영향을 미친다</span><a style="color: #ee2323;" href="https://www.nature.com/articles/s41564-024-01856-x#ref-CR1" target="_top" class="ke-link"><u>1</u></a>,<a style="color: #ee2323;" href="https://www.nature.com/articles/s41564-024-01856-x#ref-CR2" target="_top" class="ke-link"><u>2</u></a>. </b></span></p><p> </p><p><span style="color: #ee2323;"><b>그러나 </b></span></p><p><span style="color: #ee2323;"><b>동일한 식이 섭취량에서도 </b></span></p><p><span style="color: #ee2323;"><b>장내 미생물군집은 다양하게 나타난다<a style="color: #ee2323;" href="https://www.nature.com/articles/s41564-024-01856-x#ref-CR3" target="_top" class="ke-link"><u>3</u></a>,<a style="color: #ee2323;" href="https://www.nature.com/articles/s41564-024-01856-x#ref-CR4" target="_top" class="ke-link"><u>4</u></a>. </b></span></p><p> </p><p><span style="color: #006dd7;"><b>이는 장내의 다른 요인들이 이러한 변이에 기여함을 시사한다. </b></span></p><p> </p><p><span style="color: #006dd7;"><b><span data-ke-size="size20">장 통과 시간</span>은 </b></span></p><p><span style="color: #ee2323;"><b><span style="color: #006dd7;">건강한 인구의 미생물군집 구성에 상당한 변이를 설명한다<a style="color: #006dd7;" href="https://www.nature.com/articles/s41564-024-01856-x#ref-CR5" target="_top" class="ke-link"><u>5</u></a></span>,<a style="color: #ee2323;" href="https://www.nature.com/articles/s41564-024-01856-x#ref-CR6" target="_top" class="ke-link"><u>6</u></a>,<a style="color: #ee2323;" href="https://www.nature.com/articles/s41564-024-01856-x#ref-CR7" target="_top" class="ke-link"><u>7</u></a>,<a style="color: #ee2323;" href="https://www.nature.com/articles/s41564-024-01856-x#ref-CR8" target="_top" class="ke-link"><u>8</u></a>. </b></span></p><p> </p><p><span style="color: #ee2323;"><b>통과 시간이 길수록 </b></span></p><p><span style="color: #ee2323;"><b>미생물 단백질 분해와 메탄 생산이 증가한다<a style="color: #ee2323;" href="https://www.nature.com/articles/s41564-024-01856-x#ref-CR9" target="_top" class="ke-link"><u>9</u></a>. </b></span></p><p> </p><p><span style="color: #006dd7;"><b><span data-ke-size="size20">당분해의 주요 미생물 생성물인 단쇄지방산(SCFAs)</span>은 </b></span></p><p><span style="color: #006dd7;"><b>일반적으로 유익한 것으로 간주되지만10, </b></span></p><p><span style="color: #006dd7;" data-ke-size="size20"><b>미생물 단백질 분해는 </b></span></p><p><span style="color: #006dd7;" data-ke-size="size20"><b>황화수소, 암모니아, 분지쇄 지방산(BCFAs), p-크레졸, </b></span></p><p><span style="color: #006dd7;" data-ke-size="size20"><b>인돌 및 페닐아세테이트<a style="color: #006dd7;" href="https://www.nature.com/articles/s41564-024-01856-x#ref-CR11" target="_top" class="ke-link"><u>11</u></a>,<a style="color: #006dd7;" href="https://www.nature.com/articles/s41564-024-01856-x#ref-CR12" target="_top" class="ke-link"><u>12</u></a>와 같은 </b></span></p><p><span style="color: #006dd7;"><b><span data-ke-size="size20">건강 악화와 연관된 대사 산물을 생성</span>한다.</b></span></p><p> </p><p><span style="color: #ee2323;"><b><span data-ke-size="size20">장 내 pH 변화</span> 역시 </b></span></p><p><span style="color: #ee2323;"><b>장내 미생물 구성과 대사 활동과 연관되어 있다<a style="color: #ee2323;" href="https://www.nature.com/articles/s41564-024-01856-x#ref-CR13" target="_top" class="ke-link"><u>13</u></a>. </b></span></p><p><span style="color: #ee2323;"><b>SCFA 및 기타 유기산의 존재는 결장 pH를 낮추어<a style="color: #ee2323;" href="https://www.nature.com/articles/s41564-024-01856-x#ref-CR13" target="_top" class="ke-link"><u>13</u></a> </b></span></p><p><span style="color: #ee2323;"><b>산성 환경에 민감한 세균의 증식을 억제한다<a style="color: #ee2323;" href="https://www.nature.com/articles/s41564-024-01856-x#ref-CR14" target="_top" class="ke-link"><u>14</u></a>.</b></span></p><p> </p><div class="table-wrap"><table data-ke-type="table" data-ke-align="alignLeft" style="width: 100%;" border="1"><tbody><tr><td style="width: 100%;"><span style="color: #8a3db6;"> <b>아미노기 : 알칼리성</b></span><br><span style="color: #8a3db6;"><b>황산, 인산, 카르복실기 : 산성</b></span></td></tr></tbody></table></div><p> </p><p><span style="color: #006dd7;"><b>그러나 </b></span></p><p><span style="color: #006dd7;"><b>통과 시간 및 관강 pH와 같은 생리적 요인에 의해 결정되는 장 환경이 </b></span></p><p><span style="color: #006dd7;"><b>식이-숙주-미생물군집 대사와 어떻게 연관되는지에 대해서는 거의 알려져 있지 않다. </b></span></p><p> </p><p><span style="color: #006dd7;"><b>이러한 요인들을 이해하는 것은 </b></span></p><p><span style="color: #006dd7;"><b>향후 맞춤형 식이 미생물군집 기반 전략 수립에 핵심적일 수 있다.</b></span></p><p> </p><p><span style="color: #ee2323;"><b>이동 시간은</b></span></p><p><span style="color: #ee2323;"><b>무선 운동성 캡슐(SmartPills)을 사용하여 평가할 수 있으며,</b></span></p><p><span style="color: #ee2323;"><b>이는 위장관을 따라 관강 내 pH, 온도 및 압력을 측정하여 </b></span></p><p><span style="color: #ee2323;"><b>분절별 이동 시간을 결정</b></span>할 수 있게 합니다.</p><p> </p><p>SmartPills는 방사선 불투과성 마커 및 신티그래피<a href="https://www.nature.com/articles/s41564-024-01856-x#ref-CR15" target="_top" class="ke-link"><u>15</u></a>와 함께</p><p>이동 시간을 직접 평가하는 표준 임상 방법 중 하나이며,</p><p>이전 미생물군 연구<a href="https://www.nature.com/articles/s41564-024-01856-x#ref-CR16" target="_top" class="ke-link"><u>16</u></a>,<a href="https://www.nature.com/articles/s41564-024-01856-x#ref-CR17" target="_top" class="ke-link"><u>17</u></a>에서도 사용되었습니다.</p><p> </p><p><span style="color: #006dd7;"><b>본 논문에서는</b></span></p><p><span style="color: #006dd7;"><b>61명의 건강한 자원자를 대상으로 9일간의 관찰 연구를 수행하여</b></span></p><p><span style="color: #006dd7;"><b>스마트필을 통해 전장 및 분절별 통과 시간과 pH를 평가했습니다.</b></span></p><p> </p><p><span style="color: #ee2323;"><b>또한 </b></span></p><p><span style="color: #ee2323;"><b>배변 습관, 식이 섭취량, 호흡 수소 및 메탄 농도 데이터를 수집하고</b></span></p><p><span style="color: #ee2323;"><b>다중 오믹스 기법을 활용하여 소변 및 대변 샘플을 분석했습니다.</b></span></p><p> </p><p><span style="color: #006dd7;"><b>이를 통해 개인 간 및 일일 변동성을 보이는</b></span></p><p><span style="color: #006dd7;"><b>장 환경, 장내 미생물군집 및 미생물군집 유래 대사물의 변화를 추적하고</b></span></p><p><span style="color: #006dd7;"><b>연관성을 규명할 수 있었습니다</b></span>.</p><p> </p><p> </p><p>Results</p><p>Study design and participant characteristics</p><p>We enrolled 61 healthy participants (aged 39 ± 13.5 years, with body mass index (BMI) of 23.6 ± 2.8 kg m−2; Table <a style="color: #006699;" href="https://www.nature.com/articles/s41564-024-01856-x#Tab1" target="_top" class="ke-link">1</a> and Extended Data Fig. <a style="color: #006699;" href="https://www.nature.com/articles/s41564-024-01856-x#Fig6" target="_top" class="ke-link">1</a>) and asked them to maintain their habitual lifestyle and diet for 9 consecutive days (Fig. <a style="color: #006699;" href="https://www.nature.com/articles/s41564-024-01856-x#Fig1" target="_top" class="ke-link">1a</a>). The study included two visits (day 2 and day 9) where fasting blood glucose, insulin and C-peptide, as well as breath hydrogen and methane, were measured (Table <a style="color: #006699;" href="https://www.nature.com/articles/s41564-024-01856-x#Tab1" target="_top" class="ke-link">1</a>). On the first visit, participants were given a breakfast that accounted for 25% of their daily energy needs (Supplementary Table <a style="color: #006699;" href="https://www.nature.com/articles/s41564-024-01856-x#MOESM1" target="_top" class="ke-link">1</a>) to provide a standardized meal before a subset of the volunteers (<i>n</i> = 50) ingested a wireless motility capsule (SmartPill) to measure whole-gut and segmental transit time and pH<a style="color: #006699;" href="https://www.nature.com/articles/s41564-024-01856-x#ref-CR18" target="_top" class="ke-link">18</a>. While previous investigations used granola bars (SmartBar) before the monitoring<a style="color: #006699;" href="https://www.nature.com/articles/s41564-024-01856-x#ref-CR19" target="_top" class="ke-link">19</a>,<a style="color: #006699;" href="https://www.nature.com/articles/s41564-024-01856-x#ref-CR20" target="_top" class="ke-link">20</a>, we used a complex meal similar to a recent study<a style="color: #006699;" href="https://www.nature.com/articles/s41564-024-01856-x#ref-CR21" target="_top" class="ke-link">21</a> to investigate diet–microbiota interactions. Postprandial breath and urine samples were obtained as indicated in Fig. <a style="color: #006699;" href="https://www.nature.com/articles/s41564-024-01856-x#Fig1" target="_top" class="ke-link">1a</a>. The participants recorded daily 24 h dietary records (days 1–8) using the myfood24 nutrition platform (<a href="https://www.myfood24.org" target="_top" class="ke-link">https://www.myfood24.org</a>); noted daily bowel habits including defecation time, stool consistency assessed by the Bristol Stool Form Scale (BSS)<a style="color: #006699;" href="https://www.nature.com/articles/s41564-024-01856-x#ref-CR22" target="_top" class="ke-link">22</a> and stool frequency (number of bowel movements per day); and collected daily urine (the first morning sample) and faecal samples (the first bowel movement). The study population had normal bowel habits (Table <a style="color: #006699;" href="https://www.nature.com/articles/s41564-024-01856-x#Tab1" target="_top" class="ke-link">1</a>) with a median BSS of type 4 and 1 bowel movement per day. Transit time was also estimated by a self-administered sweet-corn transit time test<a style="color: #006699;" href="https://www.nature.com/articles/s41564-024-01856-x#ref-CR23" target="_top" class="ke-link">23</a> on days 3 and 5 (corn TT). We measured faecal water content (indication of stool moisture, a proxy marker of transit time<a style="color: #006699;" href="https://www.nature.com/articles/s41564-024-01856-x#ref-CR23" target="_top" class="ke-link">23</a>), pH and microbial load in all collected faecal samples (<i>n</i> = 484). All collected urine samples (daily spot and postprandial samples, <i>n</i> = 1,154) and a subset of faecal samples (<i>n</i> = 170) were profiled by untargeted liquid chromatography–mass spectrometry (LC-MS)-metabolomics to obtain urine and faecal metabolomes. Finally, we obtained the gut microbiome composition via 16S ribosomal RNA (rRNA) gene sequencing of a subset of faecal samples (<i>n</i> = 362) and assessed both relative microbiome profiles (RMPs) and quantitative microbiome profiles (QMPs) after adjusting for microbial load<a style="color: #006699;" href="https://www.nature.com/articles/s41564-024-01856-x#ref-CR24" target="_top" class="ke-link">24</a>.</p><p> </p><p>연구 설계 및 참가자 특성</p><p> </p><p><span style="color: #ee2323;"><b>61명의 건강한 참가자(평균 연령 39±13.5세, </b></span></p><p><span style="color: #ee2323;"><b>체질량지수(BMI) 23.6±2.8 kg/m−2; 표 <a style="color: #ee2323;" href="https://www.nature.com/articles/s41564-024-01856-x#Tab1" target="_top" class="ke-link"><u>1</u></a> 및 확장 데이터 그림 <a style="color: #ee2323;" href="https://www.nature.com/articles/s41564-024-01856-x#Fig6" target="_top" class="ke-link"><u>1</u></a>)를 모집하여 </b></span></p><p><span style="color: #ee2323;"><b>9일 연속으로 평소 생활습관과 식단을 유지하도록 요청했습니다(그림 <a style="color: #ee2323;" href="https://www.nature.com/articles/s41564-024-01856-x#Fig1" target="_top" class="ke-link"><u>1a</u></a>). </b></span></p><p> </p><p><span style="color: #006dd7;"><b>이 연구에는 두 차례의 방문(2일차 및 9일차)이 포함되었으며, </b></span></p><p><span style="color: #006dd7;"><b>이때 <span data-ke-size="size20">공복 혈당, 인슐린 및 C-펩타이드와 호</span></b></span><span style="color: #006dd7;"><b><span data-ke-size="size20">흡 수소 및 메탄을 측정</span>했습니다(표 <a style="color: #006dd7;" href="https://www.nature.com/articles/s41564-024-01856-x#Tab1" target="_top" class="ke-link"><u>1</u></a>). </b></span></p><p> </p><p><span style="color: #ee2323;"><b>첫 방문에서 참가자들은 일일 에너지 요구량의 25%에 해당하는 아침 식사(보충 자료 표 <a style="color: #ee2323;" href="https://www.nature.com/articles/s41564-024-01856-x#MOESM1" target="_top" class="ke-link"><u>1</u></a>)를 제공받았으며, </b></span></p><p><span style="color: #ee2323;"><b>일부 자원자(<i>n</i> = 50)는 무선 운동성 캡슐(SmartPill)을 섭취하여 </b></span></p><p><span style="color: #ee2323;"><b>전장 및 분절별 통과 시간과 pH를 측정하기 전에 표준화된 식사를 제공받았습니다<a style="color: #ee2323;" href="https://www.nature.com/articles/s41564-024-01856-x#ref-CR18" target="_top" class="ke-link"><u>18</u></a>. </b></span></p><p> </p><p>이전 연구에서는 모니터링 전에 그래놀라 바(SmartBar)를 사용했지만<a href="https://www.nature.com/articles/s41564-024-01856-x#ref-CR19" target="_top" class="ke-link"><u>19</u></a>,<a href="https://www.nature.com/articles/s41564-024-01856-x#ref-CR20" target="_top" class="ke-link"><u>20</u></a>,</p><p>우리는 식이-미생물군 상호작용을 조사하기 위해 최근 연구<a href="https://www.nature.com/articles/s41564-024-01856-x#ref-CR21" target="_top" class="ke-link"><u>21</u></a>과 유사한 복합 식사를 사용했습니다.</p><p> </p><p>식후 호흡 및 소변 샘플은 그림 <a href="https://www.nature.com/articles/s41564-024-01856-x#Fig1" target="_top" class="ke-link"><u>1a</u></a>에 표시된 대로</p><p>채취하였다.</p><p> </p><p>참가자들은 myfood24 영양 플랫폼(<u></u><u><a href="https://www.myfood24.org" target="_top" class="ke-link">https://www.myfood24.org</a></u>)을 사용하여</p><p>1~8일차 동안 매일 24시간 식이 기록을 작성하였으며,</p><p>배변 시간, 브리스톨 변형 척도(BSS)<a href="https://www.nature.com/articles/s41564-024-01856-x#ref-CR22" target="_top" class="ke-link"><u>22</u></a>로 평가한 변의 농도, 배변 빈도(일일 배변 횟수)를 포함한</p><p>일일 배변 습관을 기록하였다.</p><p> </p><p>(일일 배변 횟수)를 기록했으며,</p><p>매일 아침 첫 소변과 첫 배변 시 대변 샘플을 채취했다.</p><p> </p><p>연구 대상자는 정상적인 배변 습관(표 <a href="https://www.nature.com/articles/s41564-024-01856-x#Tab1" target="_top" class="ke-link"><u>1</u></a>)을 보였으며,</p><p>중앙값 BSS는 4형,</p><p>일일 배변 횟수는 1회였다.</p><p> </p><p>또한 3일차와 5일차에</p><p>자가 투여형 스위트콘 통과 시간 검사<a href="https://www.nature.com/articles/s41564-024-01856-x#ref-CR23" target="_top" class="ke-link"><u>23</u></a>(옥수수 TT)을 통해 통과 시간을 추정했다.</p><p> </p><p><span style="color: #ee2323;"><b> 수집된 모든 대변 샘플(<i>n</i> = 484)에서 </b></span></p><p><span style="color: #ee2323;"><b>대변 수분 함량(대변 수분의 지표, </b></span></p><p><span style="color: #ee2323;"><b>통과 시간의 대리 지표<a style="color: #ee2323;" href="https://www.nature.com/articles/s41564-024-01856-x#ref-CR23" target="_top" class="ke-link"><u>23</u></a>), </b></span></p><p><span style="color: #ee2323;"><b>pH 및 미생물 부하를 측정했습니다 .</b></span></p><p> </p><p><span style="color: #006dd7;"><b>수집된 모든 소변 샘플(일일 스팟 및 식후 샘플, <i>n</i> = 1,154)과 </b></span></p><p><span style="color: #006dd7;"><b>일부 대변 샘플(<i>n</i> = 170)은 </b></span></p><p><span style="color: #006dd7;"><b>비표적 액체 크로마토그래피-질량 분석법(LC-MS) 대사체학 분석을 통해 </b></span></p><p><span style="color: #006dd7;"><b>소변 및 대변 대사체 프로파일을 얻었다.</b></span></p><p> </p><p> </p><p><span style="color: #ee2323;" data-ke-size="size18"><b>마지막으로, </b></span></p><p><span style="color: #ee2323;" data-ke-size="size18"><b>일부 대변 샘플(<i>n</i> = 362)의 16S 리보솜 RNA(rRNA) 유전자 시퀀싱을 통해 </b></span></p><p><span style="color: #ee2323;" data-ke-size="size18"><b>장내 미생물군 구성 정보를 얻었으며, </b></span></p><p><span style="color: #ee2323;" data-ke-size="size18"><b>미생물 부하를 조정한 후 상대적 미생물군 프로파일(RMP)과 </b></span></p><p><span style="color: #ee2323;" data-ke-size="size18"><b>정량적 미생물군 프로파일(QMP)을 모두 평가</b></span>하였다<a href="https://www.nature.com/articles/s41564-024-01856-x#ref-CR24" target="_top" class="ke-link"><u>24</u></a>.</p><p> </p><div class="figure-img" data-ke-type="image" data-ke-style="alignCenter" data-ke-mobilestyle="widthOrigin"><img src="https://t1.daumcdn.net/cafeattach/z4ZG/3b87272c677b74a02a18b00decb0b4a520032833" class="txc-image" data-img-src="https://t1.daumcdn.net/cafeattach/z4ZG/3b87272c677b74a02a18b00decb0b4a520032833" data-origin-width="1280" data-origin-height="1374"></div><div class="figure-img" data-ke-type="image" data-ke-style="alignCenter" data-ke-mobilestyle="widthOrigin"><img src="https://t1.daumcdn.net/cafeattach/z4ZG/90e2732087a0abff07b830f7064bb7832fc523c6" class="txc-image" data-img-src="https://t1.daumcdn.net/cafeattach/z4ZG/90e2732087a0abff07b830f7064bb7832fc523c6" data-origin-width="1280" data-origin-height="670"></div><div class="table-wrap"><table data-ke-type="table" data-ke-align="alignLeft" style="width: 100%;" border="1"><tbody><tr><td style="width: 100%;"><span data-ke-size="size20"><b> 개념</b></span><br><span style="color: #ee2323;"><b>1) S : svedberg unit : RNA의 크기, 모양, 밀도에 의한 침강계수 </b></span><br><span style="color: #ee2323;"><b>2) 원핵생물 리보솜 = 70S 리보솜 = 30S 리보솜 + 50S 리보솜</b></span><br><span style="color: #ee2323;"><b>3) 16S rRNA는 30S 리보솜 단위가 가진 variable regions, conserved regions 특성을 지님.</b></span><br><br><span style="color: #006dd7;"><b>16S rRNA검사를 통해 미생물군의 종류와 양을 측정할 수 있음<br></b><br></span><span style="color: #8a3db6;"><b>순서 : 원핵생물 추출 --> 원핵생물을 파쇄 --> 원심분리 </b></span><br><span style="color: #8a3db6;"><b>         --> 리보솜 추출 --> 다시 원심분리하면 스베드베르그 단위(1-200단위정도)까지 측정</b></span><br><span style="color: #8a3db6;"><b>        1 스베드베르그 단위가 가장 아래 가라앉음</b></span><br><span style="color: #8a3db6;"><b>        16번째 리보솜 RNA가 원핵생물의 종류와 양을 알려줌 </b> </span></td></tr></tbody></table></div><p> </p><p><b>Table 1 Participants’ characteristics (<i>N</i> = 61)</b></p><p><a style="color: #006699; background-color: #ffffff;" href="https://www.nature.com/articles/s41564-024-01856-x/tables/1" target="_top" class="ke-link">Full size table</a></p><p><b>Fig. 1: PRIMA study design and variations in gut environmental factors, gut microbiome and metabolomes.</b></p><div class="figure-img" data-ke-type="image" data-ke-style="alignCenter" data-ke-mobilestyle="widthOrigin"><img src="https://t1.daumcdn.net/cafeattach/z4ZG/23d34fa7ce885f4bb5f7d7992398976bdd71087d" class="txc-image" width="685" height="750" data-img-src="https://t1.daumcdn.net/cafeattach/z4ZG/23d34fa7ce885f4bb5f7d7992398976bdd71087d" data-origin-width="685" data-origin-height="750"></div><p><b>a</b>, PRIMA study design. The study included two site visits, at which fasting blood and breath samples were taken. At visit 1, anthropometric measurements were attained, and all participants were given a standardized breakfast; a subset of 50 volunteers ingested SmartPills immediately after. Postprandial breath hydrogen and methane were measured every 30 min for 6 h, and postprandial urine was collected at 0.5 h and every hour until 24 h as indicated. On days 3 and 5, participants performed a sweet-corn test to measure WGTT. In addition, daily 24 h dietary records (days 1–8), records of bowel habits (stool consistency, stool frequency and time of defecation) and daily urine and faecal samples were obtained. Solid line indicates sample collection on site and dashed line sample collection at home. <b>b</b>, Inter- and intra-individual variations in the gut environmental factors over the 9 consecutive days. The red and blue lines represent median and mean values, respectively. Grey lines represent intra-individual fluctuations over time. Asterisks indicate the statistical significance of mixed-effect models accounting for repeated measures (two-sided ***<i>P</i> < 0.001, **<i>P</i> < 0.01, *<i>P</i> < 0.05; NS, not significant; see Supplementary Table <a style="color: #006699;" href="https://www.nature.com/articles/s41564-024-01856-x#MOESM1" target="_top" class="ke-link">3</a> for details; no adjustment for multiple testing was applied). <b>c</b>, Percentage of variation explained by individual and study day in the gut microbiome and urine and faecal metabolomes based on PERMANOVA tests (two-sided *<i>P</i> < 0.05).</p><p><a style="color: #006699; background-color: #ffffff;" href="https://www.nature.com/articles/s41564-024-01856-x/figures/1" target="_top" class="ke-link">Full size image</a></p><p> </p><p>Gut environment stability varies for each individual</p><p>Daily sampling allowed us to eval‎uate the fluctuations in gut environmental factors, faecal and urine metabolomes, gut microbiomes and diets within and between healthy adults over time (Supplementary Fig. <a style="color: #006699;" href="https://www.nature.com/articles/s41564-024-01856-x#MOESM1" target="_top" class="ke-link">1</a>). First, we observed varying degrees of day-to-day fluctuations within individuals for faecal pH (coefficient of intra-individual variation (CVIntra) 0.3–8.1%), BSS (0–57.8%), stool frequency (0–73.1%), stool moisture (2.2–24%) and microbial load (7.6–72.7%) (Fig. <a style="color: #006699;" href="https://www.nature.com/articles/s41564-024-01856-x#Fig1" target="_top" class="ke-link">1b</a> and Supplementary Table <a style="color: #006699;" href="https://www.nature.com/articles/s41564-024-01856-x#MOESM4" target="_top" class="ke-link">2</a>), suggesting that some individuals have more stable gut environments than others. Most of the gut environmental factors varied within individuals over the 9 days, whereas faecal pH remained relatively stable (Fig. <a style="color: #006699;" href="https://www.nature.com/articles/s41564-024-01856-x#Fig1" target="_top" class="ke-link">1b</a> and Supplementary Table <a style="color: #006699;" href="https://www.nature.com/articles/s41564-024-01856-x#MOESM1" target="_top" class="ke-link">3a</a>). Participant ID explained a significant proportion of variation for day-to-day fluctuations in all of the gut environmental factors (Supplementary Table <a style="color: #006699;" href="https://www.nature.com/articles/s41564-024-01856-x#MOESM1" target="_top" class="ke-link">3b</a>), indicating that the stability of the gut environment is to some extent personal.</p><p>Next, we performed a permutational multivariate analysis of variance (PERMANOVA) on the QMPs, urine and faecal metabolomes and found that the individual explained more than 50% of the inter-individual variations in all three cases (Fig. <a style="color: #006699;" href="https://www.nature.com/articles/s41564-024-01856-x#Fig1" target="_top" class="ke-link">1c</a>). The sampling day explained on average 6.7% of the urine metabolome variation but did not explain day-to-day variations in the gut microbiome and faecal metabolome. (Fig. <a style="color: #006699;" href="https://www.nature.com/articles/s41564-024-01856-x#Fig1" target="_top" class="ke-link">1c</a>). By inspecting the β-diversities of individual microbiome and metabolome profiles, we observed that some individuals showed less variation over the study period than others (Extended Data Fig. <a style="color: #006699;" href="https://www.nature.com/articles/s41564-024-01856-x#Fig7" target="_top" class="ke-link">2</a>).</p><p>Stool moisture and pH explain daily gut microbiome fluctuations</p><p>To explore what drives the intra-individual fluctuation in the metabolomes and the microbiome, we performed distance-based redundancy analysis (db-RDA). We considered daily dietary macronutrients and fibres, as well as the gut environmental factors. None of the dietary components explained intra-individual fluctuations in the gut microbiome or metabolomes. By contrast, stool moisture, faecal pH, BSS and time of defecation markedly affected the gut microbiome (QMP, genus level; Fig. <a style="color: #006699;" href="https://www.nature.com/articles/s41564-024-01856-x#Fig2" target="_top" class="ke-link">2a</a>), explaining 3.5%, 2.5%, 2% and 1.3% of the variations, respectively. Similar results were observed using the RMP data (Extended Data Fig. <a style="color: #006699;" href="https://www.nature.com/articles/s41564-024-01856-x#Fig8" target="_top" class="ke-link">3a</a>) and in previous studies<a style="color: #006699;" href="https://www.nature.com/articles/s41564-024-01856-x#ref-CR6" target="_top" class="ke-link">6</a>,<a style="color: #006699;" href="https://www.nature.com/articles/s41564-024-01856-x#ref-CR25" target="_top" class="ke-link">25</a>. Notably, these explanatory factors are proxies for gut transit time, suggesting that day-to-day variations in transit time are reflected in the gut microbiome variation.</p><p> </p><p><span style="color: #ee2323;"><b>개체마다 장 환경 안정성이 다름</b></span></p><p> </p><p><b><span style="color: #006dd7;">일일 샘플링을 통해 건강한 성인 내·간에서 시간에 따른 </span></b></p><p><b><span style="color: #006dd7;">장 환경 요인, 대변·소변 대사체, 장내 미생물군집 및 식단의 변동성을 평가</span></b>할 수 있었다(보충 그림 <a href="https://www.nature.com/articles/s41564-024-01856-x#MOESM1" target="_top" class="ke-link"><u>1</u></a>).</p><p> </p><p><b><span style="color: #ee2323;">첫째, 개체 내 대변 pH(개체 내 변동계수 (CVIntra) 0.3–8.1%), BSS (0–57.8%), 배변 빈도 (0–73.1%), 대변 수분 함량 (2.2–24%) 및 미생물 부하 (7.6–72.7%)에서 관찰되었으며(그림</span> <a href="https://www.nature.com/articles/s41564-024-01856-x#Fig1" target="_top" class="ke-link"><u>1b</u></a> 및 보충 자료 표 <a href="https://www.nature.com/articles/s41564-024-01856-x#MOESM4" target="_top" class="ke-link"><u>2</u></a>), 이는 일부 개인이 다른 개인보다 더 안정적인 장 환경을 가질 수 있음을 시사한다.</b> 대부분의 장 환경 요인은 9일 동안 개인 내에서 변동한 반면, 분변 pH는 상대적으로 안정적으로 유지되었다(그림 <a href="https://www.nature.com/articles/s41564-024-01856-x#Fig1" target="_top" class="ke-link"><u>1b</u></a> 및 보충 자료 표 <a href="https://www.nature.com/articles/s41564-024-01856-x#MOESM1" target="_top" class="ke-link"><u>3a</u></a>). 참가자 ID는 모든 장 환경 요인의 일일 변동에서 상당한 변동 비율을 설명하였다(보충 자료 표 <a href="https://www.nature.com/articles/s41564-024-01856-x#MOESM1" target="_top" class="ke-link"><u>3b</u></a>). 이는 장 환경의 안정성이 어느 정도 개인에 따라 다르다는 것을 시사한다.</p><p> </p><p><span style="color: #ee2323;"><b>다음으로, QMP, 소변 및 대변 대사체에 대해 순환 다변량 분산분석(PERMANOVA)을 수행한 결과, 세 가지 경우 모두에서 개인이 개인 간 변이의 50% 이상을 설명하는 것으로 나타났다</b></span>(그림 <a href="https://www.nature.com/articles/s41564-024-01856-x#Fig1" target="_top" class="ke-link"><u>1c</u></a>). 채취일은 소변 대사체 변이의 평균 6.7%를 설명했으나, 장내 미생물군집과 대변 대사체의 일일 변동은 설명하지 못했다(그림 <a href="https://www.nature.com/articles/s41564-024-01856-x#Fig1" target="_top" class="ke-link"><u>1c</u></a>). 개별 미생물군집 및 대사체 프로파일의 β-다양성을 분석한 결과, 일부 개인은 연구 기간 동안 다른 개인보다 변동성이 적게 나타났다 (확장 데이터 그림 <a href="https://www.nature.com/articles/s41564-024-01856-x#Fig7" target="_top" class="ke-link"><u>2</u></a>).</p><p> </p><p><b>Fig. 2: Intra- and inter-individual variations in gut microbiome and urine metabolome explained by gut environment.</b></p><div class="figure-img" data-ke-type="image" data-ke-style="alignCenter" data-ke-mobilestyle="widthOrigin"><img src="https://t1.daumcdn.net/cafeattach/z4ZG/d0c66da8937b208b49b285ac45d818d2eecc704b" class="txc-image" width="685" height="1229" data-img-src="https://t1.daumcdn.net/cafeattach/z4ZG/d0c66da8937b208b49b285ac45d818d2eecc704b" data-origin-width="685" data-origin-height="1229"></div><p><b>a</b>,<b>b</b>, Contributions of dietary and gut environmental factors on intra-individual variations in gut microbiome (QMP, all days) (<b>a</b>) and urine metabolome (all days, all features) (<b>b</b>). <b>c</b>, Boxplots showing segmental and WGTT measured by the SmartPill (<i>n</i> = 50) at day 2 and mean transit time of sweet corn (<i>n</i> = 61, day 3 and day 5) with each dot representing an individual. <b>d</b>, Boxplots showing pH throughout the gastrointestinal tract measured by the SmartPill (<i>n</i> = 50) and in faeces measured by pH meter at day 2 (<i>n</i> = 61) with each dot representing an individual. <b>e</b>,<b>f</b>, Contributions of clinical variables, dietary components, gut environmental and physiological factors and participant characteristics to inter-individual variations in the gut microbiome (QMP, sample closest to the capsule body exit) (<b>e</b>) and urine metabolome (24 h, day 2, all features) (<b>f</b>). Panels <b>a</b>, <b>b</b>, <b>e</b> and <b>f</b> were quantified by db-RDA with permutation tests using Bray–Curtis distances. Effect sizes are plotted. The asterisks indicate statistical significance after adjustments for multiple testing (*<i>q</i> < 0.1). See Extended Data Fig. <a style="color: #006699;" href="https://www.nature.com/articles/s41564-024-01856-x#Fig8" target="_top" class="ke-link">3a,b</a> for RMPs and faecal metabolome. Boxplot centre in <b>c</b> and <b>d</b> represents median, and box represents interquartile range (IQR). Whiskers extend to most extreme data point <1.5 IQR. SB, small bowel; CH4, breath methane; H2, breath hydrogen.</p><p> </p><p><b>a</b>,<b>b</b>, 식이 및 장 환경 요인이 장내 미생물군집(QMP, 모든 날짜)</p><p>(<b>a</b>) 및 소변 대사체군(모든 날짜, 모든 특징)의 개인 내 변이에 미치는 기여도 (<b>b</b>). <b>c</b>, SmartPill로 측정한 단편 및 WGTT(<i>n</i> = 50)의 박스플롯(2일차) 및 단옥수수의 평균 통과 시간(<i>n</i> = 61, 3일차 및 5일차)을 나타낸 것으로, 각 점은 개체를 나타냄. <b>d</b>, SmartPill로 측정한 위장관 전체의 pH(<i>n</i> = 50) 및 2일차에 pH 측정기로 측정한 대변의 pH(<i>n</i> = 61)를 나타내는 박스플롯. 각 점은 개인을 나타냄. <b>e</b>,<b>f</b>, 장내 미생물군집(QMP, 캡슐 체내 배출 시점 가장 가까운 샘플)(<b>e</b>) 및 소변 대사체군(24시간, 2일차, 모든 특징)(<b>f</b>)의 개인 간 변이에 대한 임상 변수, 식이 구성 요소, 장 환경 및 생리적 요인, 참가자 특성의 기여도. 패널 <b>a</b>, <b>b</b>, <b>e</b> 및 <b>f</b>는 Bray–Curtis 거리를 사용한 순열 검정(permutation test)을 통한 db-RDA로 정량화되었습니다. 효과 크기가 플롯되었습니다. 별표는 다중 검정 조정 후 통계적 유의성을 나타냅니다(*<i>q</i><0.1). RMP 및 분변 대사체에 대해서는 확장 데이터 그림 <a href="https://www.nature.com/articles/s41564-024-01856-x#Fig8" target="_top" class="ke-link">3a,b</a>를 참조하십시오. <b>c</b> 및 <b>d</b>의 박스플롯 중앙은 중앙값을 나타내며, 박스는 사분위수 범위(IQR)를 나타냅니다. 수염은 가장 극단적인 데이터 포인트(<1.5 IQR)까지 확장됩니다. SB, 소장; CH4, 호흡 메탄; H2, 호흡 수소.</p><p> </p><p><a style="color: #006699;" href="https://www.nature.com/articles/s41564-024-01856-x#MOESM5" target="_top" class="ke-link">Source data</a></p><p><a style="color: #006699; background-color: #ffffff;" href="https://www.nature.com/articles/s41564-024-01856-x/figures/2" target="_top" class="ke-link">Full size image</a></p><p>Stool moisture and faecal pH further explained 3.1% and 3%, respectively, of the intra-individual variation in urine metabolomes, despite subtle day-to-day fluctuations (Fig. <a style="color: #006699;" href="https://www.nature.com/articles/s41564-024-01856-x#Fig2" target="_top" class="ke-link">2b</a>). This suggests that even small changes in the colonic water content and pH may be associated with the host–microbiota metabolism. However, these observations could also be influenced by daily diet variations. Gut environmental factors did not contribute to the intra-individual fluctuations in the faecal metabolomes (Extended Data Fig. <a style="color: #006699;" href="https://www.nature.com/articles/s41564-024-01856-x#Fig8" target="_top" class="ke-link">3b</a>). It should be noted that faecal metabolome data were derived only from three consecutive days, and stool moisture still tended (<i>P</i> = 0.081) to have an effect.</p><p> </p><p><span style="color: #333333; background-color: #ffffff;" data-ke-size="size16">대변 수분 함량과 분변 pH는 미세한 일일 변동에도 불구하고 소변 대사체 내 개인 내 변이의 각각 3.1%와 3%를 추가로 설명하였다(그림 </span><a style="color: #0070d1; background-color: #ffffff;" href="https://www.nature.com/articles/s41564-024-01856-x#Fig2" target="_top" class="ke-link">2b</a><span style="color: #333333; background-color: #ffffff;" data-ke-size="size16">). 이는 대장 수분 함량과 pH의 미세한 변화조차도 숙주-미생물군집 대사와 연관될 수 있음을 시사한다. 그러나 이러한 관찰은 일일 식이 변동의 영향도 받을 수 있다. 장 환경 요인은 분변 대사체 내 개인 내 변동성에 기여하지 않았다(확장 데이터 그림 </span><a style="color: #0070d1; background-color: #ffffff;" href="https://www.nature.com/articles/s41564-024-01856-x#Fig8" target="_top" class="ke-link">3b</a>). 분변 대사체 데이터는 연속 3일분에서만 추출되었으며, 대변 수분 함량이 여전히 경향성(<i>P</i><span style="color: #333333; background-color: #ffffff;" data-ke-size="size16"> = 0.081)적으로 영향을 미쳤음을 유의해야 한다.</span></p><p> </p><p>Transit times and pH vary between individuals</p><p><span style="color: #006dd7;"><b>SmartPills were used to obtain whole-gut transit time (WGTT), gastric emptying time (GET), small-bowel transit time (SBT), colonic transit time (CTT) and intestinal transit time (ITT; SBT + CTT), as well as pH throughout the gastrointestinal tract (GIT) (Extended Data Fig. <a style="color: #006dd7;" href="https://www.nature.com/articles/s41564-024-01856-x#Fig8" target="_top" class="ke-link">3c</a>)</b></span>. In 8 individuals, the capsule was retained in the stomach for over 8 h, a common event reported in other studies<a style="color: #006699;" href="https://www.nature.com/articles/s41564-024-01856-x#ref-CR19" target="_top" class="ke-link">19</a>,<a style="color: #006699;" href="https://www.nature.com/articles/s41564-024-01856-x#ref-CR26" target="_top" class="ke-link">26</a>. Therefore, GET and WGTT values from these participants were excluded from our analyses. In addition, we could not determine CTT and WGTT in one participant due to a signal loss.</p><p> </p><p><span style="color: #ee2323;"><b>The median values of transit time were as follows: GET, 4.8 h (range 3.1–6.2 h); WGTT, 23.3 h (12.4–72.3 h); CTT, 13.6 h (2.1–63.5 h); and SBT, 5.1 h (2.5–10.3 h), in agreement with previously reported data on healthy populations</b></span><a style="color: #006699;" href="https://www.nature.com/articles/s41564-024-01856-x#ref-CR27" target="_top" class="ke-link">27</a>. For comparison, the corn TT showed a median of 23.6 h (10.8–109.7 h) at day 3 and 19.7 h (12.0–84.5 h) at day 5. Furthermore, we found a strong correlation between the two corn TT measurements (Spearman correlation coefficient (SCC) = 0.8, <i>P</i> < 0.001) suggesting consistency within individuals. The median of the mean corn TT across the two days was 21.7 h (11.7–97.1 h) (Fig. <a style="color: #006699;" href="https://www.nature.com/articles/s41564-024-01856-x#Fig2" target="_top" class="ke-link">2c</a>), similar to the WGTT obtained by the SmartPill. However, we did not observe any correlation between the WGTT and corn TT (Extended Data Fig. <a style="color: #006699;" href="https://www.nature.com/articles/s41564-024-01856-x#Fig9" target="_top" class="ke-link">4a</a>), indicating that despite providing similar results on average, individually, these two methods showed different results.</p><p>When exploring the relationships between segmental transit times, corn TT, gut environmental factors and participant characteristics (Extended Data Fig. <a style="color: #006699;" href="https://www.nature.com/articles/s41564-024-01856-x#Fig9" target="_top" class="ke-link">4a</a>), we found that the transit times recorded by both methods were negatively correlated to BSS, as also reported previously<a style="color: #006699;" href="https://www.nature.com/articles/s41564-024-01856-x#ref-CR23" target="_top" class="ke-link">23</a>,<a style="color: #006699;" href="https://www.nature.com/articles/s41564-024-01856-x#ref-CR28" target="_top" class="ke-link">28</a>. We also observed that women had significantly longer CTT compared with men, while there was no effect of menstruation status among the women (Extended Data Fig. <a style="color: #006699;" href="https://www.nature.com/articles/s41564-024-01856-x#Fig9" target="_top" class="ke-link">4b</a>).</p><p>Large inter-individual variations in the gastrointestinal segmental pH were also observed (Fig. <a style="color: #006699;" href="https://www.nature.com/articles/s41564-024-01856-x#Fig2" target="_top" class="ke-link">2d</a>) with the following median pH values in the upper GIT: the stomach (0.9, range 0.5–4.9), duodenum (6.1, 5.0–7.2) and small intestine (7.4, 6.4–8.2). pH in the proximal colon was slightly acidic (6.3, 5.3–7.0) followed by a gradual increase in the distal colon (6.9, 5.0–8.2) and sigmoid colon (7.2, 5.6–8.6). Interestingly, a small decrease in pH was observed from the sigmoid colon to the rectum (7.0, 5.7–8.6) and also in the faecal pH (6.9, 6.6–7.3), indicating that acidifying processes occur after entry into the rectum.</p><p> </p><p> </p><p> </p><p>개체 간 이동 시간 및 pH 차이</p><p> </p><p><span style="color: #ee2323;"><b>SmartPills를 사용하여 </b></span></p><p><span style="color: #ee2323;"><b>전장 이동 시간(WGTT), </b></span></p><p><span style="color: #ee2323;"><b>위 배출 시간(GET), </b></span></p><p><span style="color: #ee2323;"><b>소장 이동 시간(SBT), </b></span></p><p><span style="color: #ee2323;"><b>대장 이동 시간(CTT), </b></span></p><p><span style="color: #ee2323;"><b>장 이동 시간(ITT; SBT+CTT) 및 </b></span></p><p><span style="color: #ee2323;"><b>위장관(GIT) 전반의 pH를 측정하였다(확장 데이터 그림 <a style="color: #ee2323;" href="https://www.nature.com/articles/s41564-024-01856-x#Fig8" target="_top" class="ke-link">3c</a>).</b></span></p><p> </p><p><span style="color: #8a3db6;"><b> SmartPills were used to obtain whole-gut transit time (WGTT), </b></span></p><p><span style="color: #8a3db6;"><b>gastric emptying time (GET), </b></span></p><p><span style="color: #8a3db6;"><b>small-bowel transit time (SBT), </b></span></p><p><span style="color: #8a3db6;"><b>colonic transit time (CTT) and </b></span></p><p><span style="color: #8a3db6;"><b>intestinal transit time (ITT; SBT + CTT), as well as </b></span></p><p><span style="color: #8a3db6;"><b>pH throughout the gastrointestinal tract (GIT) (Extended Data Fig. <a style="color: #8a3db6;" href="https://www.nature.com/articles/s41564-024-01856-x#Fig8" target="_top" class="ke-link">3c</a>) </b></span></p><p> </p><p><b><span style="color: #006dd7;">8명의 참가자에서 캡슐이 위에서 </span></b></p><p><b><span style="color: #006dd7;">8시간 이상 체류하는 현상이 관찰되었으며, </span></b></p><p><b><span style="color: #006dd7;">이는 다른 연구에서도 보고된 흔한 사례이다<a style="color: #006dd7;" href="https://www.nature.com/articles/s41564-024-01856-x#ref-CR19" target="_top" class="ke-link">19</a>,<a style="color: #006dd7;" href="https://www.nature.com/articles/s41564-024-01856-x#ref-CR26" target="_top" class="ke-link">26</a>. </span></b></p><p> </p><p><span style="color: #ee2323;"><b>따라서 </b></span></p><p><b><span style="color: #006dd7;"><span style="color: #ee2323;">해당 참가자들의 위 배출 시간(GET) 및 전체 장 통과 시간(WGTT) 값은 분석에서 제외</span>하였다. </span></b></p><p> </p><p><b><span style="color: #006dd7;">또한 신호 손실로 인해 한 </span></b></p><p><b><span style="color: #006dd7;">참가자의 대장 통과 시간(CTT)과 전체 장 통과 시간(WGTT)을 측정할 수 없었다</span></b>.</p><p> </p><p>통과 시간의 중앙값은 다음과 같습니다:</p><p> </p><p><span style="color: #ee2323;"><b>위 배출 시간(GET), 4.8시간(범위 3.1–6.2시간); </b></span></p><p><span style="color: #ee2323;"><b>전장 통과 시간(WGTT), 23.3시간(12.4–72.3시간); </b></span></p><p><span style="color: #ee2323;"><b>대장 통과 시간(CTT), 13.6시간(2.1–63.5시간); </b></span></p><p><span style="color: #ee2323;"><b>소장 통과시간 SBT 5.1시간(2.5–10.3시간)으로, </b></span></p><p><span style="color: #ee2323;"><b>건강한 인구에 대한 기존 보고 데이터<a style="color: #ee2323;" href="https://www.nature.com/articles/s41564-024-01856-x#ref-CR27" target="_top" class="ke-link">27</a>과 일치했습니다.</b></span></p><p> </p><p><b>The median values of transit time were as follows: GET, 4.8 h (range 3.1–6.2 h); WGTT, 23.3 h (12.4–72.3 h); CTT, 13.6 h (2.1–63.5 h); and SBT, 5.1 h (2.5–10.3 h), in agreement with previously reported data on healthy populations</b></p><p> </p><div class="figure-img" data-ke-type="image" data-ke-style="alignCenter" data-ke-mobilestyle="widthOrigin"><img src="https://t1.daumcdn.net/cafeattach/z4ZG/dc0dd0a11038143fca2a856596e0965fba98aa1f" class="txc-image" data-img-src="https://t1.daumcdn.net/cafeattach/z4ZG/dc0dd0a11038143fca2a856596e0965fba98aa1f" data-origin-width="542" data-origin-height="600"></div><div class="figure-img" data-ke-type="image" data-ke-style="alignCenter" data-ke-mobilestyle="widthOrigin"><img src="https://t1.daumcdn.net/cafeattach/z4ZG/aa50dbbaff636bd12f45f53e0f909af538910940" class="txc-image" data-img-src="https://t1.daumcdn.net/cafeattach/z4ZG/aa50dbbaff636bd12f45f53e0f909af538910940" data-origin-width="353" data-origin-height="337"></div><div class="figure-img" data-ke-type="image" data-ke-style="alignCenter" data-ke-mobilestyle="widthOrigin"><img src="https://t1.daumcdn.net/cafeattach/z4ZG/72c420b34959303f18e190db3286b1d42c305567" class="txc-image" data-img-src="https://t1.daumcdn.net/cafeattach/z4ZG/72c420b34959303f18e190db3286b1d42c305567" data-origin-width="800" data-origin-height="600"></div><div class="figure-img" data-ke-type="image" data-ke-style="alignCenter" data-ke-mobilestyle="widthOrigin"><img src="https://t1.daumcdn.net/cafeattach/z4ZG/2126ab7c8cb229ca67e184f28522fc7988e10bff" class="txc-image" data-img-src="https://t1.daumcdn.net/cafeattach/z4ZG/2126ab7c8cb229ca67e184f28522fc7988e10bff" data-origin-width="640" data-origin-height="447"></div><div class="figure-file" data-ke-type="file" data-file-src="https://t1.daumcdn.net/cafeattach/z4ZG/ddf0c93b58e7c8e86917ba64642dd36e3426485c?download" data-file-name="111명 음식물 장 통과시간 연구.pdf" data-file-size="1643895" data-mimetype="application/pdf" data-ke-align="alignCenter"><a href="javascript:checkVirus('grpid%3Dz4ZG%26fldid%3DK5v7%26dataid%3D414%26fileid%3D18%26regdt%3D20250909073544&url=https%3A%2F%2Ft1.daumcdn.net%2Fcafeattach%2Fz4ZG%2Fddf0c93b58e7c8e86917ba64642dd36e3426485c')"><div class="image"></div><div class="desc"><div class="filename"><span class="name">111명 음식물 장 통과시간 연구</span><span class="type">.pdf</span></div><div class="size">1.57MB</div></div></a></div><div class="figure-img" data-ke-type="image" data-ke-style="alignCenter" data-ke-mobilestyle="widthOrigin"><img src="https://t1.daumcdn.net/cafeattach/z4ZG/19d92ffb316fa6debf1f4ccc29e5e6c0defc156f" class="txc-image" data-img-src="https://t1.daumcdn.net/cafeattach/z4ZG/19d92ffb316fa6debf1f4ccc29e5e6c0defc156f" data-origin-width="1067" data-origin-height="362"></div><p> </p><p>위장관 통과 시간의 중앙값은 다음과 같았다:<br>GET(위 배출 시간), 4.8시간(범위 3.1–6.2시간);<br>WGTT(전 위장관 통과 시간), 23.3시간(12.4–72.3시간);<br>CTT(대장 통과 시간), 13.6시간(2.1–63.5시간);<br>SBT(소장 통과 시간), 5.1시간(2.5–10.3시간).</p><p>이는 건강한 집단에서 이전에 보고된 데이터와 일치하였다.</p><p> </p><p>비교를 위해 옥수수 통과 시간(corn TT)은 3일째에 중앙값 23.6시간(10.8–109.7시간), 5일째에 19.7시간(12.0–84.5시간)이었다. 또한, 두 번의 옥수수 TT 측정 간에는 강한 상관관계(스피어만 상관계수 SCC = 0.8, P < 0.001)가 관찰되어 개인 내에서 일관성이 있음을 시사했다.</p><p>두 날짜의 평균 옥수수 TT의 중앙값은 21.7시간(11.7–97.1시간)이었으며(Fig. 2c), SmartPill로 얻은 WGTT와 유사하였다. 그러나 WGTT와 옥수수 TT 간에는 상관관계가 관찰되지 않아(Extended Data Fig. 4a), 평균적으로는 유사한 결과를 제공하지만 개인 단위에서는 서로 다른 결과를 보인다는 점을 나타냈다.</p><p> </p><p>위장관 분절별 통과 시간, 옥수수 TT, 장내 환경 요인, 참여자 특성 간의 관계를 탐색한 결과(Extended Data Fig. 4a), 두 방법으로 기록된 통과 시간은 BSS(브리스톨 대변 척도)와 음의 상관관계를 보였으며, 이는 이전 보고와도 일치했다. 또한 여성은 남성에 비해 CTT가 유의하게 더 길었으나, 여성 내에서는 월경 상태에 따른 차이는 없었다(Extended Data Fig. 4b).</p><p> </p><p>장 분절별 pH에서도 큰 개인차가 관찰되었으며(Fig. 2d), 상부 위장관의 중앙값 pH는 다음과 같았다: 위(0.9, 범위 0.5–4.9), 십이지장(6.1, 5.0–7.2), 소장(7.4, 6.4–8.2). 근위부 결장은 약산성(6.3, 5.3–7.0)을 보였으며, 이후 원위부 결장(6.9, 5.0–8.2)과 에스결장(7.2, 5.6–8.6)으로 갈수록 점차 증가하였다. 흥미롭게도, 에스결장에서 직장으로 갈 때 pH가 소폭 감소(7.0, 5.7–8.6)하였고, 대변 pH(6.9, 6.6–7.3)도 낮아지는 양상을 보여 직장에 들어간 이후 산성화 과정이 일어남을 시사하였다.</p><p> </p><p> </p><p> </p><p>CTT and pH contribute to gut microbiome variations</p><p>To quantify how participant characteristics, clinical variables, diet and gut environmental and physiological factors explain inter-individual variations in the gut microbiome and metabolomes, we performed a db-RDA using data derived from faecal and 24 h urine collections on day 2 from all participants (<i>n</i> = 61; Supplementary Table <a style="color: #006699;" href="https://www.nature.com/articles/s41564-024-01856-x#MOESM4" target="_top" class="ke-link">4</a>). Moreover, we performed the same analysis with whole-gut and segmental transit times and pH derived from the SmartPills on day 2 (<i>n</i> = 50). Stool moisture and distal colon pH were key factors associated with inter-individual variation in QMPs (Fig. <a style="color: #006699;" href="https://www.nature.com/articles/s41564-024-01856-x#Fig2" target="_top" class="ke-link">2e</a>), accounting for 5.5% and 5% of the variation, respectively, on day 2 and also other days (Supplementary Table <a style="color: #006699;" href="https://www.nature.com/articles/s41564-024-01856-x#MOESM4" target="_top" class="ke-link">4</a>). Unlike previously reported data from larger cohorts<a style="color: #006699;" href="https://www.nature.com/articles/s41564-024-01856-x#ref-CR5" target="_top" class="ke-link">5</a>, BSS did not explain a significant proportion of the variation in QMP in this population. WGTT, CTT, corn TT and faecal pH explained 9.1%, 6.2%, 4.9% and 5.4%, respectively, of the inter-individual variations in the 24 h urine metabolome, in comparison to age, which explained 4.5% of the variation (Fig. <a style="color: #006699;" href="https://www.nature.com/articles/s41564-024-01856-x#Fig2" target="_top" class="ke-link">2f</a>). These contributions were consistent when testing against the urine metabolomes on different days (Supplementary Table <a style="color: #006699;" href="https://www.nature.com/articles/s41564-024-01856-x#MOESM4" target="_top" class="ke-link">4</a>). By contrast, segmental transit time did not contribute to the inter-individual variation in the faecal metabolomes, whereas pH in the distal colon and fibre intake showed the largest effects explaining 6.8% and 5.9% of the variations, respectively; however, this was not significant after adjusting for multiple testing (Supplementary Table <a style="color: #006699;" href="https://www.nature.com/articles/s41564-024-01856-x#MOESM4" target="_top" class="ke-link">4</a>).</p><p>We also tested the effect of menstruation during the study period for women (non-menstruating, <i>n</i> = 30; menstruating, <i>n</i> = 13), which showed effect sizes of 3.7% (gut microbiome) and 3.6% (urine metabolome), however without statistical significance. Considering the notable effect size of age on urine metabolome and a significant age difference between the two groups of women (<i>P</i> = 0.01), age might contribute to these observed effects. Our results emphasize that the personal gut environment contributes considerably to the inter-individual differences in the gut microbiota and urinary metabolic profiles.</p><p> </p><p><span style="color: #ee2323;"><b>CTT와 pH는 장내 미생물군집 변이에 기여한다</b></span></p><p>참가자 특성, 임상 변수, 식이 및 장 환경·생리학적 요인이 장내 미생물군집과 대사체군집의 개인 간 변이를 어떻게 설명하는지 정량화하기 위해, 모든 참가자(<i>n</i> = 61; 보충 자료 표 <a href="https://www.nature.com/articles/s41564-024-01856-x#MOESM4" target="_top" class="ke-link">4</a>)의 2일차 대변 및 24시간 소변 수집 데이터로 db-RDA를 수행했다. 또한, 2일차에 SmartPills로 측정된 전체 장 및 부분별 통과 시간과 pH를 사용하여 동일한 분석을 수행했습니다(<i>n</i> = 50).</p><p> </p><p><span style="color: #006dd7;"><b>대변 수분 함량과 원위 결장 pH는 </b></span></p><p><span style="color: #006dd7;"><b>QMP의 개인 간 변이와 연관된 핵심 요인으로(그림 <a style="color: #006dd7;" href="https://www.nature.com/articles/s41564-024-01856-x#Fig2" target="_top" class="ke-link">2e</a>), </b></span></p><p><span style="color: #006dd7;"><b>2일차 및 기타 날짜(보충 자료 표 <a style="color: #006dd7;" href="https://www.nature.com/articles/s41564-024-01856-x#MOESM4" target="_top" class="ke-link">4</a>)에 각각 변이의 5.5%와 5%를 설명하였다. </b></span></p><p> </p><p>대규모 코호트에서 보고된 기존 데이터<a href="https://www.nature.com/articles/s41564-024-01856-x#ref-CR5" target="_top" class="ke-link">5</a>와 달리, 본 집단에서는 BSS가 QMP 변이의 상당 부분을 설명하지 못했다. WGTT, CTT, 옥수수 TT 및 대변 pH는 24시간 소변 대사체 변이의 개인 간 변이를 각각 9.1%, 6.2%, 4.9%, 5.4% 설명했으며, 이는 변이의 4.5%를 설명한 연령과 비교된다(그림 <a href="https://www.nature.com/articles/s41564-024-01856-x#Fig2" target="_top" class="ke-link">2f</a>). 이러한 기여도는 다른 날짜의 소변 대사체군을 대상으로 테스트했을 때도 일관되게 나타났습니다(보충 자료 <a href="https://www.nature.com/articles/s41564-024-01856-x#MOESM4" target="_top" class="ke-link">4</a>). 반면, 분절 통과 시간은 대변 대사체군의 개인 간 변이에 기여하지 않았으며, 원위 결장 pH와 섬유질 섭취량이 각각 변이의 6.8%와 5.9%를 설명하는 가장 큰 영향을 보였습니다. 그러나 다중 검정 조정 후에는 유의미하지 않았습니다(보충 자료 <a href="https://www.nature.com/articles/s41564-024-01856-x#MOESM4" target="_top" class="ke-link">4</a>).</p><p> </p><p>또한 연구 기간 중</p><p>여성의 월경 영향(비월경군, <i>n</i> = 30; 월경군, <i>n</i> = 13)을 분석한 결과,</p><p>장내 미생물군집은 3.7%,</p><p>소변 대사체군은 3.6%의 효과 크기를 보였으나</p><p>통계적 유의성은 없었다.</p><p> </p><p>연령이 소변 대사체에 미치는 영향 크기가 유의미하고</p><p>두 여성 집단 간 연령 차이가 유의미한 점(<i>P</i>=0.01)을 고려할 때,</p><p>연령이 관찰된 효과에 기여할 수 있습니다.</p><p> </p><p><span style="color: #ee2323;"><b> 본 연구 결과는 </b></span></p><p><span style="color: #ee2323;"><b>개인의 장 환경이 </b></span></p><p><span style="color: #ee2323;"><b>장내 미생물군집과 소변 대사 프로파일의 개인 간 차이에 </b></span></p><p><span style="color: #ee2323;"><b>상당한 기여를 한다는 점을 강조합니다</b></span>.</p><p> </p><p>Individual gut microbiota and metabolite profiles are dynamic</p><p>We next assessed intra-individual fluctuations in microbial-derived metabolites including breath hydrogen and methane, faecal SCFAs (acetate, propionate, butyrate, valerate and caproate) and BCFAs (isobutyrate, isovalerate and 2-methylbutyrate; Table <a style="color: #006699;" href="https://www.nature.com/articles/s41564-024-01856-x#Tab1" target="_top" class="ke-link">1</a>), as well as 16 other microbial-derived metabolites detected in faeces and urine, including the proteolytic markers, <i>p</i>-cresol sulfate (PCS), phenylacetylglutamine (PAGln) and indoxyl sulfate. Substantial day-to-day fluctuations were observed (Fig. <a style="color: #006699;" href="https://www.nature.com/articles/s41564-024-01856-x#Fig3" target="_top" class="ke-link">3a</a> and Supplementary Fig. <a style="color: #006699;" href="https://www.nature.com/articles/s41564-024-01856-x#MOESM1" target="_top" class="ke-link">2</a>). Breath methane and hydrogen had a median CVIntra of 141% and 47%, respectively, with a moderate positive correlation between the two time points for both gases (hydrogen, SCC = 0.42, <i>P</i> < 0.001; methane, SCC = 0.66, <i>P</i> < 0.001). Faecal concentrations of the SCFAs and BCFAs fluctuated considerably from day to day (median CVIntra ranging from 26% to 40%) with valerate varying the least and acetate the most. Similarly, the relative abundances of the proteolytic markers varied substantially from day to day with a median CVIntra of 26%, 42% and 39% for PAGln, indoxyl sulfate and PCS, respectively. These findings suggest that microbial-derived metabolites in breath, faeces and urine fluctuate from day to day on a habitual diet.</p><p> </p><p>개별 장내 미생물군과 대사체 프로파일은 동적입니다</p><p> </p><p><span style="color: #ee2323;"><b>다음으로 </b></span></p><p><span style="color: #ee2323;"><b>호흡 수소 및 메탄, 분변 SCFA(아세테이트, 프로피오네이트, 부티레이트, 발레레이트, 카프로에이트) 및 </b></span></p><p><span style="color: #ee2323;"><b>BCFA(이소부티레이트, 이소발레레이트, 2-메틸부티레이트; 표 <a style="color: #ee2323;" href="https://www.nature.com/articles/s41564-024-01856-x#Tab1" target="_top" class="ke-link">1</a>) 및 </b></span></p><p><span style="color: #ee2323;"><b>분변과 소변에서 검출된 16종의 기타 미생물 유래 대사체(단백질 분해 표지물질인 <i>p</i>-크레졸 설페이트(PCS), </b></span></p><p><span style="color: #ee2323;"><b>페닐아세틸글루타민(PAGln), 인독실 설페이트 포함)를 평가했습니다. </b></span></p><p> </p><p><span style="color: #ee2323;"><b>상당한 일일 변동성이 관찰되었습니다(그림 <a style="color: #ee2323;" href="https://www.nature.com/articles/s41564-024-01856-x#Fig3" target="_top" class="ke-link">3a</a> 및 보충 그림 <a style="color: #ee2323;" href="https://www.nature.com/articles/s41564-024-01856-x#MOESM1" target="_top" class="ke-link">2</a>). </b></span></p><p> </p><p><span style="color: #ee2323;"><b>호흡 메탄과 수소의 CVIntra 중앙값은 각각 141%와 47%였으며, </b></span></p><p><span style="color: #ee2323;"><b>두 가스 모두 두 시점 간에 중간 정도의 양의 상관관계가 관찰되었습니다</b></span></p><p><span style="color: #ee2323;"><b>(수소, SCC = 0.42, <i>P</i> < 0.001; 메탄, SCC = 0.66, <i>P</i> < 0.001). </b></span></p><p> </p><p><span style="color: #006dd7;" data-ke-size="size18"><b>대변 내 SCFA 및 BCFA 농도는 </b></span></p><p><span style="color: #006dd7;" data-ke-size="size18"><b>일일 변동성이 매우 컸으며(일내 변동계수 중앙값 26%~40%), </b></span></p><p><span style="color: #006dd7;" data-ke-size="size18"><b>발레레이트가 가장 적게 변동하고 </b></span></p><p><span style="color: #006dd7;" data-ke-size="size18"><b>아세테이트가 가장 크게 변동했다. </b></span></p><p> </p><p><span style="color: #ee2323;"><b>마찬가지로, 단백질 분해 표지물질의 상대적 풍부도도 일일 변동성이 컸으며, </b></span></p><p><span style="color: #ee2323;"><b>PAGln, 인독실 설페이트, PCS의 일내 변동계수 중앙값은 각각 26%, 42%, 39%였다. </b></span></p><p> </p><p><span style="color: #ee2323;"><b>이러한 결과는 일상적인 식이 상태에서 </b></span></p><p><span style="color: #ee2323;"><b>호흡, 분변, 소변 내 미생물 유래 대사물질이 일일 변동성을 보임을 시사한다.</b></span></p><p> </p><p><b>Fig. 3: Fluctuations in microbial metabolites and their correlations to gut physiology and environment.</b></p><div class="figure-img" data-ke-type="image" data-ke-style="alignCenter" data-ke-mobilestyle="widthOrigin"><img src="https://t1.daumcdn.net/cafeattach/z4ZG/e243aca72e66dd4cd847b5f8695c335cf9cd7d68" class="txc-image" width="685" height="897" data-img-src="https://t1.daumcdn.net/cafeattach/z4ZG/e243aca72e66dd4cd847b5f8695c335cf9cd7d68" data-origin-width="685" data-origin-height="896"></div><p><b>a</b>, Intra-individual fluctuations in microbial metabolites measured in breath, faeces and urine. Boxplots show coefficients of intra-individual variations. Each dot represents an individual (<i>n</i> = 61). Boxplot centre represents median, and box represents IQR. Whiskers extend to most extreme data point <1.5 IQR. <b>b</b>,<b>c</b>, Correlations between microbial metabolites and gut physiology and environmental factors as assessed by repeated measures correlation coefficient (<b>b</b>) or the Spearman correlation coefficient (<b>c</b>). The asterisks indicate statistical significance after adjustment for multiple testing (****<i>q</i> < 0.001, ***<i>q</i> < 0.01, **<i>q</i> < 0.05, *<i>q</i> < 0.1). Blue, brown and yellow bars indicate breath, faecal and urine metabolites, respectively. The black bar in <b>b</b> indicates repeated measure correlations where daily values for each variable have been used (Extended Data Fig. <a style="color: #006699;" href="https://www.nature.com/articles/s41564-024-01856-x#Fig10" target="_top" class="ke-link">5</a>), whereas the green bar in <b>c</b> indicates analysis based on data collected on day 2. Postprandial hydrogen and methane were only measured at one time point and therefore were not included in the repeated measure analysis. (f), faecal; TMAO, trimethylamine <i>N</i>-oxide.</p><p><a style="color: #006699;" href="https://www.nature.com/articles/s41564-024-01856-x#MOESM6" target="_top" class="ke-link">Source data</a></p><p><a style="color: #006699; background-color: #ffffff;" href="https://www.nature.com/articles/s41564-024-01856-x/figures/3" target="_top" class="ke-link">Full size image</a></p><p>Next, we used repeated measures (Fig. <a style="color: #006699;" href="https://www.nature.com/articles/s41564-024-01856-x#Fig3" target="_top" class="ke-link">3b</a>, Extended Data Fig. <a style="color: #006699;" href="https://www.nature.com/articles/s41564-024-01856-x#Fig10" target="_top" class="ke-link">5</a> and Supplementary Table <a style="color: #006699;" href="https://www.nature.com/articles/s41564-024-01856-x#MOESM1" target="_top" class="ke-link">5</a>) and Spearman correlation analysis (Fig. <a style="color: #006699;" href="https://www.nature.com/articles/s41564-024-01856-x#Fig3" target="_top" class="ke-link">3c</a>) to find links between specific microbial metabolites and the gut environment along with diet. Faecal SCFAs were negatively correlated to faecal pH with butyrate showing the strongest correlation (<i>r</i> = −0.77, <i>q</i> < 0.001) in line with previous human studies<a style="color: #006699;" href="https://www.nature.com/articles/s41564-024-01856-x#ref-CR29" target="_top" class="ke-link">29</a>. Moreover, higher faecal propionate (SCC = −0.25, <i>q</i> < 0.1) was linked to shorter CTT with a similar tendency observed for faecal butyrate (SCC = −0.29, <i>P</i> < 0.05, <i>q</i> = 0.3). Faecal butyrate also tended to negatively correlate with rectal pH (SCC = −0.37, <i>P</i> < 0.05, <i>q</i> = 0.2) but not with pH in other segments of the colon, suggesting that butyrate production may contribute to the reduced pH observed in the rectum and faeces.</p><p> </p><p><b>그림 3: 미생물 대사 산물의 변동 및 장 생리학적·환경적 요인과의 상관관계.</b></p><p><b>a</b>, 호흡, 분변, 소변에서 측정된 미생물 대사 산물의 개인 내 변동. 박스플롯은 개인 내 변동 계수를 나타냅니다. 각 점은 개체를 나타냅니다(<i>n</i> = 61). 박스플롯 중심은 중앙값, 박스는 IQR을 나타냅니다. 수염은 가장 극단적인 데이터 포인트(<1.5 IQR)까지 확장됩니다. <b>b</b>,<b>c</b>, 반복 측정 상관 계수(<b>b</b>) 또는 스피어만 상관 계수(<b>c</b>)로 평가한 미생물 대사산물과 장 생리 및 환경 요인 간의 상관관계. 별표는 다중 검정 조정 후 통계적 유의성을 나타냄(****<i>q</i><0.001, ***<i>q</i><0.01, **<i>q</i><0.05, *<i>q</i><0.1). 파란색, 갈색, 노란색 막대는 각각 호흡, 분변, 소변 대사물을 나타냅니다. <b>b</b>의 검은색 막대는 각 변수의 일일 값을 사용한 반복 측정 상관관계를 나타냅니다(확장 데이터 그림 <a href="https://www.nature.com/articles/s41564-024-01856-x#Fig10" target="_top" class="ke-link">5</a>). 반면 <b>c</b>의 녹색 막대는 2일차에 수집된 데이터를 기반으로 한 분석을 나타냅니다. 식후 수소 및 메탄은 단일 시점에서만 측정되었으므로 반복 측정 분석에 포함되지 않았습니다. (f), 분변; TMAO, 트리메틸아민 <i>N</i>-옥사이드.</p><p> </p><p><span style="color: #ee2323;"><b>다음으로, </b></span></p><p><span style="color: #ee2323;"><b>반복 측정(그림 <a style="color: #ee2323;" href="https://www.nature.com/articles/s41564-024-01856-x#Fig3" target="_top" class="ke-link">3b</a>, 확장 데이터 그림 <a style="color: #ee2323;" href="https://www.nature.com/articles/s41564-024-01856-x#Fig10" target="_top" class="ke-link">5</a> 및 보충 자료 표 <a style="color: #ee2323;" href="https://www.nature.com/articles/s41564-024-01856-x#MOESM1" target="_top" class="ke-link">5</a>)과 스피어만 상관 분석(그림 <a style="color: #ee2323;" href="https://www.nature.com/articles/s41564-024-01856-x#Fig3" target="_top" class="ke-link">3c</a>)을 통해 </b></span></p><p><span style="color: #ee2323;"><b>특정 미생물 대사산물과 장 환경 및 식이 간의 연관성을 찾았습니다. </b></span></p><p> </p><p><span style="color: #006dd7;"><b>분변 SCFA는 분변 pH와 음의 상관관계를 보였으며, </b></span></p><p><span style="color: #006dd7;"><b>부티레이트가 가장 강한 상관관계(<i>r</i> = −0.77, <i>q</i> < 0.001)를 나타내어 </b></span></p><p><span style="color: #006dd7;"><b>기존 인간 연구<a style="color: #006dd7;" href="https://www.nature.com/articles/s41564-024-01856-x#ref-CR29" target="_top" class="ke-link">29</a>와 일치했습니다. </b></span></p><p> </p><p><span style="color: #ee2323;"><b>또한, </b></span></p><p><span style="color: #ee2323;"><b>높은 분변 프로피오네이트(SCC = −0.25, <i>q</i> < 0.1)는 </b></span></p><p><span style="color: #ee2323;"><b>더 짧은 CTT와 연관되었으며, </b></span></p><p><span style="color: #ee2323;"><b>분변 부티레이트(SCC = −0.29, <i>P</i> < 0.05, <i>q</i> = 0.3)에서도 유사한 경향이 관찰되었습니다. </b></span></p><p> </p><p><span style="color: #ee2323;"><b>대변 부티레이트는 </b></span></p><p><span style="color: #ee2323;"><b>또한 직장 pH와 음의 상관관계를 보였으나(SCC = −0.37, P < 0.05, q = 0.2) </b></span></p><p><span style="color: #ee2323;"><b>결장의 다른 부위의 pH와는 상관관계가 없었으며, </b></span></p><p><span style="color: #ee2323;"><b>이는 부티레이트 생성이 직장과 대변에서 관찰되는 pH 감소에 기여할 수 있음을 시사한다.</b></span></p><p> </p><p> </p><p> </p><p>Proteolytic markers including urinary PAGln and faecal BCFAs were negatively correlated to stool moisture, and urinary PCS correlated positively with faecal pH (PAGln, <i>r</i> = −0.12, <i>q</i> < 0.1; isobutyrate, <i>r</i> = −0.39, <i>q</i> < 0.05; isovalerate, <i>r</i> = −0.37, <i>q</i> < 0.1; 2-methylbutyrate, <i>r</i> = −0.43, <i>q</i> < 0.05; PCS, <i>r</i> = 0.12, <i>q</i> < 0.1). Similarly, higher urinary levels of PCS were associated with longer CTT and ITT (SCC = 0.48, SCC = 0.44, respectively, <i>q</i> < 0.05), with similar tendencies observed for PAGln and indole-lactic acid. Furthermore, breath methane was linked to lower stool moisture and longer CTT. It is worth noting that none of this was shown for SBT, indicating that CTT determines the abundance of these metabolites and supports the hypothesis that longer passage through the colon is linked to microbial proteolysis possibly due to the depletion of substrates for saccharolytic fermentation<a style="color: #006699;" href="https://www.nature.com/articles/s41564-024-01856-x#ref-CR9" target="_top" class="ke-link">9</a>,<a style="color: #006699;" href="https://www.nature.com/articles/s41564-024-01856-x#ref-CR30" target="_top" class="ke-link">30</a>. Urinary indoxyl-glucuronide was positively associated with pH in the distal colon (SCC = 0.33, <i>q</i> < 0.1), and a similar trend was found between urinary PCS and rectal pH (SCC = 0.32, <i>P</i> < 0.05). These metabolites did not correlate to pH in the small intestine and the proximal colon, indicating a higher contribution of microbial proteolysis to pH in the distal gut compared with the proximal gut. In summary, CTT and colonic pH, but not SBT and small-intestinal pH, are associated with levels of several microbial metabolites in breath, faeces and urine. In addition, we found several associations between microbial metabolites and dietary components (Supplementary Table <a style="color: #006699;" href="https://www.nature.com/articles/s41564-024-01856-x#MOESM1" target="_top" class="ke-link">5</a>) with notable inverse correlations between the intake of dietary fibres and faecal BCFAs, urinary PCS and urinary PAGln, respectively.</p><p> </p><p style="text-align: start;">단백질 분해 지표인 요중 PAGln 및 분변 BCFAs는</p><p style="text-align: start;">분변 수분과 음의 상관관계를 보였으며,</p><p style="text-align: start;">요중 PCS는 분변 pH와 양의 상관관계를 나타냈다(PAGln, <i>r</i> = −0.12, <i>q</i> < 0.1; 이소부티레이트, <i>r</i> = −0.39, <i>q</i> < 0.05; 이소발레레이트, <i>r</i> = −0.37, <i>q</i> < 0.1; 2-메틸부티레이트, <i>r</i>=−0.43, <i>q</i><0.05; PCS, <i>r</i>=0.12, <i>q</i><0.1).</p><p style="text-align: start;"> </p><p style="text-align: start;">마찬가지로,</p><p style="text-align: start;">소변 내 PCS 수치가 높을수록 CTT와 ITT가 길어지는 경향이 관찰되었으며(각각 SCC=0.48, SCC=0.44, <i>q</i><0.05),</p><p style="text-align: start;">PAGln과 인돌-젖산에서도 유사한 경향이 나타났습니다.</p><p style="text-align: start;"> </p><p style="text-align: start;">또한 호흡 메탄은 대변 수분 감소 및 CTT 증가와 연관되었다.</p><p style="text-align: start;"> </p><p style="text-align: start;"><span style="color: #006dd7;" data-ke-size="size18"><b>주목할 점은</b></span></p><p style="text-align: start;"><span style="color: #006dd7;" data-ke-size="size18"><b>이러한 연관성이 SBT에서는 관찰되지 않았다는 것으로,</b></span></p><p style="text-align: start;"><span style="color: #006dd7;" data-ke-size="size18"><b>이는 CTT가 해당 대사체들의 풍부도를 결정하며,</b></span></p><p style="text-align: start;"><span style="color: #006dd7;" data-ke-size="size18"><b>대장 통과 시간이 길어질수록 당분해 발효의 기질이 고갈되어</b></span></p><p style="text-align: start;"><span style="color: #006dd7;" data-ke-size="size18"><b>미생물 단백질 분해가 증가할 수 있다는 가설을 지지한다<a style="color: #006dd7;" href="https://www.nature.com/articles/s41564-024-01856-x#ref-CR9" target="_top" class="ke-link">9</a>,<a style="color: #006dd7;" href="https://www.nature.com/articles/s41564-024-01856-x#ref-CR30" target="_top" class="ke-link">30</a>.</b></span></p><p style="text-align: start;"> </p><p style="text-align: start;">요중 인독실-글루쿠로니드는</p><p style="text-align: start;">원위 결장 pH와 양의 상관관계를 보였으며(SCC=0.33, <i>q</i><0.1),</p><p style="text-align: start;">요중 PCS와 직장 pH 사이에서도 유사한 경향이 관찰되었다(SCC=0.32, <i>P</i><0.05).</p><p style="text-align: start;"> </p><p style="text-align: start;">이러한 대사산물들은</p><p style="text-align: start;">소장 및 상부 결장의 pH와는 상관관계가 없었으며,</p><p style="text-align: start;">이는 원위부 장에서 미생물 단백질 분해가 근위부 장에 비해 pH에 더 큰 기여를 함을 시사한다.</p><p style="text-align: start;"> </p><p style="text-align: start;"><span style="color: #ee2323;"><b>요약하면,</b></span></p><p style="text-align: start;"><span style="color: #ee2323;"><b>CTT와 결장 pH는</b></span></p><p style="text-align: start;"><span style="color: #ee2323;"><b>호흡, 대변, 소변 내 여러 미생물 대사산물 수준과 연관성이 있으나,</b></span></p><p style="text-align: start;"><span style="color: #ee2323;"><b>SBT와 소장 pH는 그렇지 않다.</b></span></p><p style="text-align: start;"> </p><p style="text-align: start;"><span style="color: #006dd7;"><b>또한 미생물 대사산물과 식이 성분 간 여러 연관성을 발견했으며(보충 자료 <a style="color: #006dd7;" href="https://www.nature.com/articles/s41564-024-01856-x#MOESM1" target="_top" class="ke-link">5</a>),</b></span></p><p style="text-align: start;"><span style="color: #006dd7;"><b>특히 식이섬유 섭취량과</b></span></p><p style="text-align: start;"><span style="color: #006dd7;"><b>대변 BCFA, 요중 PCS, 요중 PAGln 간 역상관 관계가 두드러졌습니다.</b></span></p><p> </p><p>Faecal and urine metabolomes are linked to transit time and pH</p><p>To explore unknown metabolic features related to gut physiology, we used untargeted metabolomics to profile the urine and faecal metabolomes. We applied univariate and multivariate statistical models on all molecular features identified in urine and faeces. We first used sparse partial least squares (SPLS) models on the SmartPill-derived data and urine metabolomes from 24 h postprandial urine collected on day 2 and faecal metabolomes collected closest to the SmartPill egestion. We then performed linear regression models on the same data and further investigated features selected by both models (446 unique features; Supplementary Table <a style="color: #006699;" href="https://www.nature.com/articles/s41564-024-01856-x#MOESM4" target="_top" class="ke-link">6</a>).</p><p>Several metabolic features in urine and faeces were associated with whole-gut and segmental transit time and pH (Fig. <a style="color: #006699;" href="https://www.nature.com/articles/s41564-024-01856-x#Fig4" target="_top" class="ke-link">4a,b</a>). To investigate these features in further detail, the corresponding samples were analysed by tandem mass spectrometry (MS2) and by matching with authentic standards when available, resulting in the identification of 33 metabolites (Supplementary Tables <a style="color: #006699;" href="https://www.nature.com/articles/s41564-024-01856-x#MOESM1" target="_top" class="ke-link">7</a> and <a style="color: #006699;" href="https://www.nature.com/articles/s41564-024-01856-x#MOESM1" target="_top" class="ke-link">8</a>).</p><p> </p><p>대변 및 요 대사체는 통과 시간 및 pH와 연관됨</p><p> </p><p>장 생리학과 관련된 알려지지 않은 대사적 특징을 탐색하기 위해,</p><p>비표적 대사체학을 활용하여</p><p>요 및 대변 대사체 프로파일을 분석했습니다.</p><p> </p><p>소변과 대변에서 확인된 모든 분자적 특징에 대해</p><p>단변량 및 다변량 통계 모델을 적용했습니다.</p><p> </p><p>먼저 SmartPill 추출 데이터와 2일차 식후 24시간 소변에서 수집한 소변 대사체, SmartPill 배출 시점에</p><p>가장 가까운 시점에 수집한</p><p>대변 대사체에 대해 스파스 부분최소제곱(SPLS) 모델을 사용했습니다.</p><p> </p><p>이후 동일한 데이터에 선형 회귀 모델을 수행하고</p><p>두 모델 모두에서 선별된 특징을 추가로 조사했습니다 (446개 고유 특징; 보충 자료 표 <a href="https://www.nature.com/articles/s41564-024-01856-x#MOESM4" target="_top" class="ke-link">6</a>).</p><p> </p><p><span style="color: #ee2323;"><b>소변 및 대변 내 여러 대사 특징이 </b></span></p><p><span style="color: #ee2323;"><b>전체 장 및 구간별 통과 시간 및 pH와 연관성을 보였다(그림 <a style="color: #ee2323;" href="https://www.nature.com/articles/s41564-024-01856-x#Fig4" target="_top" class="ke-link">4a,b</a>). </b></span></p><p> </p><p><span style="color: #ee2323;"><b>이러한 특징을 보다 상세히 조사하기 위해 </b></span></p><p><span style="color: #ee2323;"><b>해당 샘플을 탠덤 질량 분석법(MS2)으로 분석하고, </b></span></p><p><span style="color: #ee2323;"><b>가능한 경우 표준 물질과 대조하여 33개 대사체를 확인하였다(보충 자료 표 <a style="color: #ee2323;" href="https://www.nature.com/articles/s41564-024-01856-x#MOESM1" target="_top" class="ke-link">7</a> 및 <a style="color: #ee2323;" href="https://www.nature.com/articles/s41564-024-01856-x#MOESM1" target="_top" class="ke-link">8</a>).</b></span></p><p> </p><p> </p><p><b>Fig. 4: Metabolites identified via LC-MS untargeted metabolomics associated with segmental transit time and pH.</b></p><div class="figure-img" data-ke-type="image" data-ke-style="alignCenter" data-ke-mobilestyle="widthOrigin"><img src="https://t1.daumcdn.net/cafeattach/z4ZG/8a6aa7e96260ea192fa22551c91f455e70eb7bd7" class="txc-image" width="685" height="939" data-img-src="https://t1.daumcdn.net/cafeattach/z4ZG/8a6aa7e96260ea192fa22551c91f455e70eb7bd7" data-origin-width="685" data-origin-height="939"></div><p><b>a</b>,<b>b</b>, Volcano plots derived from regression models where each dot represents a metabolic feature with blue representing statistically significant associations (FDR-adjusted <i>P</i> < 0.1) in urine (<b>a</b>) and faeces (<b>b</b>). The <i>x</i> axis shows the regression coefficient values (estimate) indicating either positive or negative associations and the <i>y</i> axis represents the −log10 transformation of the <i>P</i> value.</p><p><a style="color: #006699;" href="https://www.nature.com/articles/s41564-024-01856-x#MOESM7" target="_top" class="ke-link">Source data</a></p><p><a style="color: #006699; background-color: #ffffff;" href="https://www.nature.com/articles/s41564-024-01856-x/figures/4" target="_top" class="ke-link">Full size image</a></p><p> </p><p>Apart from urinary levels of PCS and PAGln, several other urinary metabolites derived from the breakdown of aromatic amino acids tryptophan and tyrosine by gut microbes were found to be linked with gut transit time and faecal pH. Specifically, 5-hydroxy-2-oxindole sulfate, 3-hydroxy-2-oxindole sulfate and 4-hydroxybenzoic acid sulfate were associated with longer WGTT/CTT, while 3-hydroxy-2-oxindole glucuronide correlated with higher faecal pH. By contrast, faecal tryptophan was negatively linked to faecal pH. In addition, higher faecal proline and urinary picolinoylglycine levels were linked with increased faecal and rectal pH, respectively.</p><p> </p><p>Several dicarboxylic acids in faeces, pimelic, suberic and sebacic acids were positively associated with WGTT and CTT. By contrast, faecal glutaric acid and pipecolic acid were negatively correlated with WGTT/CTT and sigmoid, rectal and faecal pH. Pipecolic acid is highly abundant in plants; however, it can also be produced by the gut microbiota from lysine<a style="color: #006699;" href="https://www.nature.com/articles/s41564-024-01856-x#ref-CR31" target="_top" class="ke-link">31</a>. Furthermore, higher urinary levels of citric acid were positively associated with pH in the proximal colon.</p><p>Moreover, faecal levels of 2-oxindole-3-acetic acid, previously linked to the New Nordic Diet and Mediterranean diet<a style="color: #006699;" href="https://www.nature.com/articles/s41564-024-01856-x#ref-CR32" target="_top" class="ke-link">32</a>,<a style="color: #006699;" href="https://www.nature.com/articles/s41564-024-01856-x#ref-CR33" target="_top" class="ke-link">33</a>, were negatively associated with WGTT, CTT and faecal pH. Similarly, faecal pantothenic and nicotinic acids were negatively associated with CTT and faecal pH, respectively. In addition, dihydroferulic acid glucuronide and argininic acid in urine were negatively associated with rectal pH, while <i>p</i>-hydroxyphenyllactic acid in faeces was negatively linked to faecal pH.</p><p>4-Hydroxyhippuric acid and several urinary markers of coffee intake, including 1-methyluric acid, 1-methylxanthine, 1,3-dimethyluric acid, 1,7-dimethyluric acid and 1,3,9-trimethyluric acid, were negatively associated with small-intestinal pH. 1-Methylxanthine and 1,3,9-trimethyluric acid in faeces were also negatively associated with WGTT or faecal pH, suggesting a link between coffee consumption and gut function. In addition, a positive correlation was observed between rectal pH and urinary 4-methylcatechol sulfate, a metabolite of quercetin found in plant-based foods<a style="color: #006699;" href="https://www.nature.com/articles/s41564-024-01856-x#ref-CR34" target="_top" class="ke-link">34</a>. Urinary taurine and faecal cholic acid were also positively associated with small-intestinal pH, supporting the role of bile acids in neutralizing the acidic chyme coming from the stomach<a style="color: #006699;" href="https://www.nature.com/articles/s41564-024-01856-x#ref-CR35" target="_top" class="ke-link">35</a>.</p><p> </p><p>Finally, urinary pseudouridine, a primary constituent of RNA, was found to be inversely associated with CTT and sigmoid colon pH, in line with our previous work<a style="color: #006699;" href="https://www.nature.com/articles/s41564-024-01856-x#ref-CR9" target="_top" class="ke-link">9</a>. Pseudouridine was also found in faeces and showed a similar inverse relationship with faecal pH, as did deoxy-xanthosine and xanthine. This suggests a link between increased cell turnover and lower colonic pH.</p><p>Altogether, by using untargeted LC-MS metabolomics, we identified several host-, microbial- and food-derived metabolites associated with WGTT, CTT and pH in the distal part of the colon emphasizing an interplay between diet, the gut environment, the host and the microbiota.</p><p> </p><p><b>그림 4: 구간별 통과 시간 및 pH와 연관된 LC-MS 비표적 대사체학으로 확인된 대사체.</b></p><p><b>a</b>,<b>b</b>, 회귀 모델에서 도출된 화산도. 각 점은 대사적 특징을 나타내며, 파란색은 통계적으로 유의한 연관성(FDR 조정 <i>P</i>値 < 0.1)을 의미함(<b>a</b>: 소변, <b>b</b>: 대변). <i>x</i>축은 양의 또는 음의 연관성을 나타내는 회귀 계수 값(추정치)을, <i>y</i>축은 <i>P</i>값의 −log10 변환값을 나타냅니다.</p><p><a href="https://www.nature.com/articles/s41564-024-01856-x#MOESM7" target="_top" class="ke-link">원본 데이터</a></p><p><a href="https://www.nature.com/articles/s41564-024-01856-x/figures/4" target="_top" class="ke-link">전체 크기 이미지</a></p><p> </p><p>소변 내 PCS 및 PAGln 농도 외에도, 장내 미생물에</p><p>의해 분해된 방향족 아미노산 트립토판과 티로신에서 유래한</p><p>여러 다른 소변 대사산물이 장 통과 시간 및 대변 pH와 연관된 것으로 확인되었습니다.</p><p> </p><p>구체적으로,</p><p>5-하이드록시-2-옥신돌 설페이트, 3-하이드록시-2-옥신돌 설페이트 및 4-하이드록시벤조산 설페이트는</p><p>더 긴 WGTT/CTT와 연관된 반면,</p><p>3-하이드록시-2-옥신돌 글루쿠로나이드(3-hydroxy-2-oxindole glucuronide)는</p><p>더 높은 대변 pH와 상관관계를 보였습니다.</p><p> </p><p>반면,</p><p>대변 트립토판은 대변 pH와 음의 상관관계를 보였습니다.</p><p> </p><p>또한,</p><p>분변 프롤린과 요중 피콜리노일글리신 수치가 높을수록</p><p>각각 분변 및 직장 pH가 증가하는 것으로 나타났다.</p><p> </p><p>분변 내 여러 디카르복실산(피멜산, 수베르산, 세바신산)은</p><p>WGTT 및 CTT와 양의 상관관계를 보였다.</p><p> </p><p>반면</p><p>분변 글루타르산과 파이페콜산은 WGTT/CTT 및 S자 결장, 직장, 분변 pH와 음의 상관관계를 나타냈다.</p><p> </p><p>파이페콜산은 식물에서 풍부하지만,</p><p>장내 미생물이 라이신<a href="https://www.nature.com/articles/s41564-024-01856-x#ref-CR31" target="_top" class="ke-link">31</a>으로부터 생성할 수도 있다.</p><p>또한, 요중 시트르산 농도가 높을수록 근위 결장 pH와 양의 상관관계를 보였다.</p><p> </p><p>더불어, 이전에 뉴 노르딕 식단 및 지중해 식단과 연관성이 보고된<a href="https://www.nature.com/articles/s41564-024-01856-x#ref-CR32" target="_top" class="ke-link">32</a>,<a href="https://www.nature.com/articles/s41564-024-01856-x#ref-CR33" target="_top" class="ke-link">33</a> 분변 내 2-옥신돌-3-아세트산 농도는 WGTT, CTT 및 분변 pH와 음의 상관관계를 보였다. 마찬가지로, 분변 판토텐산과 니코틴산은 각각 CTT 및 분변 pH와 음의 상관관계를 보였다. 또한, 소변 내 디하이드로페룰산 글루쿠로니드와 아르기닌산은 직장 pH와 음의 상관관계를 보였으며, 분변 내 p-하이드록시페닐젖산은 분변 pH와 음의 상관관계를 보였다.</p><p> </p><p>4-하이드록시히푸르산과 1-메틸요산, 1-메틸잔틴, 1,3-디메틸요산, 1,7-디메틸요산, 1,3,9-트리메틸요산을 포함한 여러 커피 섭취 관련 소변 마커들은 소장 pH와 음의 상관관계를 보였다. 대변 내 1-메틸잔틴과 1,3,9-트리메틸요산 또한 WGTT 또는 대변 pH와 음의 상관관계를 보였는데, 이는 커피 섭취와 장 기능 사이의 연관성을 시사한다. 또한 직장 pH와 식물성 식품에서 발견되는 케르세틴의 대사산물인 요중 4-메틸카테콜 설페이트 사이에 양의 상관관계가 관찰되었다<a href="https://www.nature.com/articles/s41564-024-01856-x#ref-CR34" target="_top" class="ke-link">34</a>. 요중 타우린과 분변 콜산은 소장 pH와 양의 상관관계를 보였으며, 이는 담즙산이 위에서 유입되는 산성 위액의 중화 작용을 한다는 점을 뒷받침한다<a href="https://www.nature.com/articles/s41564-024-01856-x#ref-CR35" target="_top" class="ke-link">35</a>.</p><p> </p><p>마지막으로, RNA의 주요 구성 성분인 요중 슈도우리딘은 CTT 및 S자 결장 pH와 역상관 관계가 있는 것으로 확인되었으며, 이는 우리의 이전 연구<a href="https://www.nature.com/articles/s41564-024-01856-x#ref-CR9" target="_top" class="ke-link">9</a>와 일치한다. 슈도우리딘은 분변에서도 검출되었으며, 데옥시잔토신 및 잔틴과 마찬가지로 분변 pH와 유사한 역상관 관계를 보였다. 이는 세포 회전율 증가와 낮은 결장 pH 사이의 연관성을 시사한다.</p><p> </p><p><span style="color: #ee2323;"><b>종합적으로, </b></span></p><p><span style="color: #ee2323;"><b>비표적 LC-MS 대사체학을 활용하여 우리는 </b></span></p><p><span style="color: #ee2323;"><b>식이, 장 환경, 숙주 및 미생물군집 간의 상호작용을 강조하는, </b></span></p><p><span style="color: #ee2323;"><b>대장 말단부에서 WGTT, CTT 및 pH와 연관된 </b></span></p><p><span style="color: #ee2323;"><b>여러 숙주 유래, 미생물 유래 및 식품 유래 대사체를 확인하였다.</b></span></p><p> </p><p>Microbial alpha diversity is linked to long passage</p><p>To explore potential links between the identified metabolites and the gut microbiota, Spearman correlation analysis was performed (Fig. <a style="color: #006699;" href="https://www.nature.com/articles/s41564-024-01856-x#Fig5" target="_top" class="ke-link">5</a>). Strong positive correlations between microbial alpha diversity measures and microbial proteolysis, CTT and ITT were found. On the contrary, alpha diversity correlated negatively with stool moisture and microbial saccharolysis.</p><p> </p><p>미생물 알파 다양성은 장 통과 시간과 연관됨</p><p>확인된 대사산물과 장내 미생물군집 간의 잠재적 연관성을 탐색하기 위해 스피어만 상관 분석을 수행하였다(그림 <a href="https://www.nature.com/articles/s41564-024-01856-x#Fig5" target="_top" class="ke-link">5</a>). 미생물 알파 다양성 지표와 미생물 단백질 분해, CTT 및 ITT 간 강한 양의 상관관계가 발견되었다. 반대로 알파 다양성은 대변 수분 함량 및 미생물 당류 분해와 음의 상관관계를 보였다.</p><p> </p><p><b>Fig. 5: Associations between metabolites, bacterial genera and gut environmental factors.</b></p><div class="figure-img" data-ke-type="image" data-ke-style="alignCenter" data-ke-mobilestyle="widthOrigin"><img src="https://t1.daumcdn.net/cafeattach/z4ZG/c82f51063897c1ed5d4dbd9d0bfb0a38f231d158" class="txc-image" width="685" height="964" data-img-src="https://t1.daumcdn.net/cafeattach/z4ZG/c82f51063897c1ed5d4dbd9d0bfb0a38f231d158" data-origin-width="685" data-origin-height="964"></div><p>Hydrogen and methane were measured in breath, and SCFAs and BCFAs were measured in faeces; other metabolites as indicated in brackets. (b), breath; (f), faecal metabolite; (u), urine metabolite. The colour gradient shows the Spearman correlation coefficient, and the asterisks indicate statistical significance after adjustment for multiple testing (***<i>q</i> < 0.001, **<i>q</i> < 0.01, *<i>q</i> < 0.05).</p><p><a style="color: #006699;" href="https://www.nature.com/articles/s41564-024-01856-x#MOESM8" target="_top" class="ke-link">Source data</a></p><p><a style="color: #006699; background-color: #ffffff;" href="https://www.nature.com/articles/s41564-024-01856-x/figures/5" target="_top" class="ke-link">Full size image</a></p><p>Products of microbial proteolysis and dicarboxylic acids were positively correlated with the absolute abundances of several bacterial genera including <i>Intestimonas</i>, <i>Flavonifractor</i>, <i>Eubacterium</i>, <i>Lachnospira</i>, <i>Clostridium</i>, <i>Oscillibacter</i>, <i>Alistipes</i>, <i>Dialister</i> and <i>Akkermansia</i>. The same genera negatively correlated with faecal levels of tryptophan, oxindole-3-acetic acid and various coffee-derived metabolites. Not surprisingly, these genera were also positively associated with longer ITT and CTT and higher faecal pH, and negatively associated with stool moisture and/or BSS. Conversely, SCFAs-producing genera including <i>Agathobacter</i>, <i>Faecalibacterium</i> and <i>Blautia</i><a style="color: #006699;" href="https://www.nature.com/articles/s41564-024-01856-x#ref-CR36" target="_top" class="ke-link">36</a>,<a style="color: #006699;" href="https://www.nature.com/articles/s41564-024-01856-x#ref-CR37" target="_top" class="ke-link">37</a>, along with lactate-producing <i>Streptococcus</i>, were all positively associated with faecal nicotinic acid, pantothenic acid and the coffee-derived metabolites. Notably, <i>Oscillibacter</i>, <i>Alistipes</i> and <i>Akkermansia</i> have repeatedly been found elevated in samples linked to longer transit time and/or constipation<a style="color: #006699;" href="https://www.nature.com/articles/s41564-024-01856-x#ref-CR8" target="_top" class="ke-link">8</a>,<a style="color: #006699;" href="https://www.nature.com/articles/s41564-024-01856-x#ref-CR9" target="_top" class="ke-link">9</a>,<a style="color: #006699;" href="https://www.nature.com/articles/s41564-024-01856-x#ref-CR28" target="_top" class="ke-link">28</a>, whereas butyrate-producing genera including <i>Faecalibacterium</i> and <i>Agathobacter</i> have been associated with shorter transit time<a style="color: #006699;" href="https://www.nature.com/articles/s41564-024-01856-x#ref-CR28" target="_top" class="ke-link">28</a>,<a style="color: #006699;" href="https://www.nature.com/articles/s41564-024-01856-x#ref-CR38" target="_top" class="ke-link">38</a>. In summary, these observations highlight the interdependency between gut bacteria, metabolites and gut physiology.</p><p> </p><p><b>그림 5: 대사산물, 세균 속 및 장 환경 요인 간의 연관성.</b></p><p>수소와 메탄은 호흡에서 측정되었으며, SCFAs와 BCFAs는 대변에서 측정되었습니다; 괄호 안의 기타 대사산물들. (b), 호흡; (f), 대변 대사산물; (u), 소변 대사산물. 색상 그라데이션은 스피어만 상관 계수를 나타내며, 별표는 다중 검정 조정 후 통계적 유의성을 표시합니다(***<i>q</i><0.001, **<i>q</i><0.01, *<i>q</i><0.05).</p><p> </p><p><a href="https://www.nature.com/articles/s41564-024-01856-x#MOESM8" target="_top" class="ke-link">원본 데이터</a></p><p><a href="https://www.nature.com/articles/s41564-024-01856-x/figures/5" target="_top" class="ke-link">전체 크기 이미지</a></p><p> </p><p><span style="color: #ee2323;"><b>미생물 단백질 분해 산물과 디카르복실산은 </b></span></p><p><span style="color: #ee2323;"><b><i>Intestinomonas</i>, <i>Flavonifractor</i>, <i>Eubacterium</i>, <i>Lachnospira</i>, <i>Clostridium</i>, <i>Oscillibacter</i>, <i>Alistipes</i>, <i>Dialister</i> 및 <i>Akkermansia</i>를 </b></span></p><p><span style="color: #ee2323;"><b>포함한 여러 세균 속의 절대 풍부도와 양의 상관관계를 보였다. </b></span></p><p> </p><p><span style="color: #006dd7;"><b>동일한 속들은 </b></span></p><p><span style="color: #006dd7;"><b>트립토판, 옥신돌-3-아세트산 및 다양한 커피 유래 대사 산물의 분변 수준과</b></span></p><p><span style="color: #006dd7;"><b> 음의 상관관계를 보였다. </b></span></p><p> </p><p><span style="color: #006dd7;"><b>당연하게도, </b></span></p><p><span style="color: #006dd7;"><b>이들 속은 더 긴 ITT 및 CTT, 더 높은 분변 </b></span></p><p><span style="color: #006dd7;"><b>pH와 양의 상관관계를 보였으며, </b></span></p><p><span style="color: #006dd7;"><b>대변 수분 및/또는 BSS와 음의 상관관계를 보였다. </b></span></p><p> </p><p><span style="color: #ee2323;"><b>반대로, <i>Agathobacter</i>, <i>Faecalibacterium</i> 및 <i>Blautia</i><a style="color: #ee2323;" href="https://www.nature.com/articles/s41564-024-01856-x#ref-CR36" target="_top" class="ke-link">36</a>,<a style="color: #ee2323;" href="https://www.nature.com/articles/s41564-024-01856-x#ref-CR37" target="_top" class="ke-link">37</a>을 포함한 </b></span></p><p><span style="color: #ee2323;"><b>SCFA 생성 속과 젖산 생성 <i>Streptococcus</i>는 </b></span></p><p><span style="color: #ee2323;"><b>모두 대변 니코틴산, 판토텐산 및 커피 유래 대사산물과 양의 상관관계를 보였다. </b></span></p><p> </p><p><span style="color: #ee2323;"><b>특히, <i>Oscillibacter</i>, <i>Alistipes</i> 및 <i>Akkermansia</i>는 </b></span></p><p><span style="color: #ee2323;"><b>장 통과 시간 증가 및/또는 변비와 연관된 샘플에서 </b></span></p><p><span style="color: #ee2323;"><b>반복적으로 증가된 것으로 확인되었으며<a style="color: #ee2323;" href="https://www.nature.com/articles/s41564-024-01856-x#ref-CR8" target="_top" class="ke-link">8</a>,<a style="color: #ee2323;" href="https://www.nature.com/articles/s41564-024-01856-x#ref-CR9" target="_top" class="ke-link">9</a>,<a style="color: #ee2323;" href="https://www.nature.com/articles/s41564-024-01856-x#ref-CR28" target="_top" class="ke-link">28</a>, </b></span></p><p> </p><p><span style="color: #ee2323;"><b>반면 <i>Faecalibacterium</i> 및 <i>Agathobacter</i>를 포함한 부티레이트 생성 속은 </b></span></p><p><span style="color: #ee2323;"><b>장 통과 시간 단축과 연관되었습니다<a style="color: #ee2323;" href="https://www.nature.com/articles/s41564-024-01856-x#ref-CR28" target="_top" class="ke-link">28</a>,<a style="color: #ee2323;" href="https://www.nature.com/articles/s41564-024-01856-x#ref-CR38" target="_top" class="ke-link">38</a>. </b></span></p><p> </p><p><span style="color: #006dd7;"><b>요약하면, 이러한 관찰 결과는 </b></span></p><p><span style="color: #006dd7;"><b>장내 세균, 대사산물 및 장 생리학 간의 상호 의존성을 강조합니다.</b></span></p><p> </p><p>Discussion</p><p>Gut transit time and pH are important determinants of gut microbiota composition and metabolism<a style="color: #006699;" href="https://www.nature.com/articles/s41564-024-01856-x#ref-CR7" target="_top" class="ke-link">7</a>. Here we showed substantial variation in whole-gut and segmental transit time, along with luminal pH among healthy individuals. These variations explained differences in microbiome composition and host–microbiota co-metabolism. As pH and transit time influence microbial growth and enzyme activities<a style="color: #006699;" href="https://www.nature.com/articles/s41564-024-01856-x#ref-CR39" target="_top" class="ke-link">39</a>, these factors could play a key role in shaping the gut microbial composition and metabolism along the GIT as well as microbiome responses to foods. A recent study confirmed that microbiome and metabolome compositions differ along the GIT<a style="color: #006699;" href="https://www.nature.com/articles/s41564-024-01856-x#ref-CR40" target="_top" class="ke-link">40</a>. Future studies with sampling along the GIT combined with measurements of regional pH and transit time are needed to ultimately disentangle this. Our study emphasizes that person-specific differences in the luminal pH may pose challenges for studies using pH-sensitive ingestible devices<a style="color: #006699;" href="https://www.nature.com/articles/s41564-024-01856-x#ref-CR40" target="_top" class="ke-link">40</a>,<a style="color: #006699;" href="https://www.nature.com/articles/s41564-024-01856-x#ref-CR41" target="_top" class="ke-link">41</a>. It is worth noting that repeated measurements in human studies are needed as we observed substantial daily fluctuations in microbial-derived metabolites.</p><p>We identified several metabolites associated with longer transit time that have been reported to be elevated in patient groups with constipation<a style="color: #006699;" href="https://www.nature.com/articles/s41564-024-01856-x#ref-CR42" target="_top" class="ke-link">42</a>,<a style="color: #006699;" href="https://www.nature.com/articles/s41564-024-01856-x#ref-CR43" target="_top" class="ke-link">43</a>,<a style="color: #006699;" href="https://www.nature.com/articles/s41564-024-01856-x#ref-CR44" target="_top" class="ke-link">44</a>. Among these, dicarboxylic acids including pimelic acid were associated with longer ITT and/or higher pH, and bacteria consistently associated with constipation<a style="color: #006699;" href="https://www.nature.com/articles/s41564-024-01856-x#ref-CR8" target="_top" class="ke-link">8</a>,<a style="color: #006699;" href="https://www.nature.com/articles/s41564-024-01856-x#ref-CR9" target="_top" class="ke-link">9</a>,<a style="color: #006699;" href="https://www.nature.com/articles/s41564-024-01856-x#ref-CR28" target="_top" class="ke-link">28</a>. Pimelic acid, possibly originating from microbial fatty acid metabolism<a style="color: #006699;" href="https://www.nature.com/articles/s41564-024-01856-x#ref-CR45" target="_top" class="ke-link">45</a>,<a style="color: #006699;" href="https://www.nature.com/articles/s41564-024-01856-x#ref-CR46" target="_top" class="ke-link">46</a>, has been found at higher faecal levels in patients with chronic kidney disease<a style="color: #006699;" href="https://www.nature.com/articles/s41564-024-01856-x#ref-CR47" target="_top" class="ke-link">47</a> and colorectal cancer<a style="color: #006699;" href="https://www.nature.com/articles/s41564-024-01856-x#ref-CR48" target="_top" class="ke-link">48</a>, often associated with constipation<a style="color: #006699;" href="https://www.nature.com/articles/s41564-024-01856-x#ref-CR49" target="_top" class="ke-link">49</a>,<a style="color: #006699;" href="https://www.nature.com/articles/s41564-024-01856-x#ref-CR50" target="_top" class="ke-link">50</a>. A recent study showed an increased abundance of dicarboxylic acids towards the distal gut<a style="color: #006699;" href="https://www.nature.com/articles/s41564-024-01856-x#ref-CR40" target="_top" class="ke-link">40</a>, and the authors speculated that it could be due to the catabolism of host epithelial cells. Whether longer ITT might be associated with increased epithelial cell turnover and shedding needs further research.</p><p> </p><p><b>토론</b></p><p> </p><p><span style="color: #ee2323;"><b>장 통과 시간과 pH는 </b></span></p><p><span style="color: #ee2323;"><b>장내 미생물 군집 구성과 대사의 중요한 결정 요인</b></span>이다<a href="https://www.nature.com/articles/s41564-024-01856-x#ref-CR7" target="_top" class="ke-link"><u>7</u></a>.</p><p> </p><p>본 연구에서는</p><p>건강한 개인들 사이에서 전체 장 및 구간별 통과 시간과 관강 내 pH에 상당한 변이가 있음을 보여주었다.</p><p> </p><p>이러한 변이는</p><p>미생물군 구성과 숙주-미생물 공동 대사의 차이를 설명하였다.</p><p> </p><p>pH와 통과 시간은</p><p>미생물 성장과 효소 활성에 영향을 미치므로<a href="https://www.nature.com/articles/s41564-024-01856-x#ref-CR39" target="_top" class="ke-link"><u>39</u></a>,</p><p>이러한 요인들은 위장관(GIT)을 따라 장내 미생물 구성과 대사,</p><p>그리고 음식에 대한 미생물군 반응을 형성하는 데 핵심적인 역할을 할 수 있습니다.</p><p> </p><p>최근 연구는</p><p>미생물군과 대사체 구성이 위장관(GIT)을 따라 다르다는 점을 확인했습니다<a href="https://www.nature.com/articles/s41564-024-01856-x#ref-CR40" target="_top" class="ke-link"><u>40</u></a>.</p><p> </p><p>이를 궁극적으로 규명하기 위해서는</p><p>위장관(GIT)을 따라 샘플링과 함께 지역별 pH 및 통과 시간 측정을 결합한 향후 연구가 필요합니다.</p><p> </p><p>본 연구는</p><p>인체별 내강 pH 차이가 pH 감지형 섭취형 장치<a href="https://www.nature.com/articles/s41564-024-01856-x#ref-CR40" target="_top" class="ke-link"><u>40</u></a>,<a href="https://www.nature.com/articles/s41564-024-01856-x#ref-CR41" target="_top" class="ke-link"><u>41</u></a>을 활용한 연구에</p><p>어려움을 초래할 수 있음을 강조한다.</p><p> </p><p>미생물 유래 대사산물의 상당한 일일 변동성을 관찰했기에</p><p>인간 대상 연구에서 반복 측정이 필요하다는 점은 주목할 만하다.</p><p> </p><p><span style="color: #ee2323;"><b>우리는 </b></span></p><p><span style="color: #ee2323;"><b>변비 환자 집단에서 증가된 것으로 보고된<a style="color: #ee2323;" href="https://www.nature.com/articles/s41564-024-01856-x#ref-CR42" target="_top" class="ke-link"><u>42</u></a>,<a style="color: #ee2323;" href="https://www.nature.com/articles/s41564-024-01856-x#ref-CR43" target="_top" class="ke-link"><u>43</u></a>,<a style="color: #ee2323;" href="https://www.nature.com/articles/s41564-024-01856-x#ref-CR44" target="_top" class="ke-link"><u>44</u></a> </b></span></p><p><span style="color: #ee2323;"><b>장 통과 시간과 연관된 여러 대사 산물을 확인했습니다. </b></span></p><p> </p><p><span style="color: #006dd7;"><b>이 중 피멜산(pimelic acid)을 포함한 디카르복실산(dicarboxylic acids)은 </b></span></p><p><span style="color: #006dd7;"><b>더 긴 ITT 및/또는 더 높은 pH와 연관되었으며, </b></span></p><p><span style="color: #006dd7;"><b>변비와 일관되게 연관된 박테리아<a style="color: #006dd7;" href="https://www.nature.com/articles/s41564-024-01856-x#ref-CR8" target="_top" class="ke-link"><u>8</u></a>,<a style="color: #006dd7;" href="https://www.nature.com/articles/s41564-024-01856-x#ref-CR9" target="_top" class="ke-link"><u>9</u></a>,<a style="color: #006dd7;" href="https://www.nature.com/articles/s41564-024-01856-x#ref-CR28" target="_top" class="ke-link"><u>28</u></a>과도 연관되었습니다. </b></span></p><p> </p><p><span style="color: #ee2323;"><b>미생물 지방산 대사에서 유래했을 가능성이 있는 피멜산<a style="color: #ee2323;" href="https://www.nature.com/articles/s41564-024-01856-x#ref-CR45" target="_top" class="ke-link"><u>45</u></a>,<a style="color: #ee2323;" href="https://www.nature.com/articles/s41564-024-01856-x#ref-CR46" target="_top" class="ke-link"><u>46</u></a>은 </b></span></p><p><span style="color: #ee2323;"><b>만성 신장 질환<a style="color: #ee2323;" href="https://www.nature.com/articles/s41564-024-01856-x#ref-CR47" target="_top" class="ke-link"><u>47</u></a> 및 대장암<a style="color: #ee2323;" href="https://www.nature.com/articles/s41564-024-01856-x#ref-CR48" target="_top" class="ke-link"><u>48</u></a> 환자에서 </b></span></p><p><span style="color: #ee2323;"><b>배변 시 더 높은 농도로 발견되었으며, </b></span></p><p><span style="color: #ee2323;"><b>이는 종종 변비와 연관되어 있습니다<a style="color: #ee2323;" href="https://www.nature.com/articles/s41564-024-01856-x#ref-CR49" target="_top" class="ke-link"><u>49</u></a>,<a style="color: #ee2323;" href="https://www.nature.com/articles/s41564-024-01856-x#ref-CR50" target="_top" class="ke-link"><u>50</u></a>. </b></span></p><p> </p><p>최근 연구에서는 원위부 장으로 갈수록</p><p>디카르복실산의 풍부도가 증가하는 것으로 나타났으며<a href="https://www.nature.com/articles/s41564-024-01856-x#ref-CR40" target="_top" class="ke-link"><u>40</u></a>,</p><p>저자들은 이것이 숙주 상피 세포의 이화 작용 때문일 수 있다고 추측했습니다.</p><p> </p><p>ITT가 길어질수록</p><p>상피 세포의 회전율과 탈락이 증가하는지 여부는 추가 연구가 필요합니다.</p><p> </p><p> </p><p> </p><p> </p><p>A negative association between daily fibre intake and several proteolytic markers was also observed. As dietary fibres can regulate microbial tryptophan metabolism<a style="color: #006699;" href="https://www.nature.com/articles/s41564-024-01856-x#ref-CR51" target="_top" class="ke-link">51</a>, availability of fibre in the colon may affect microbial protein fermentation associated with negative health outcomes<a style="color: #006699;" href="https://www.nature.com/articles/s41564-024-01856-x#ref-CR11" target="_top" class="ke-link">11</a>,<a style="color: #006699;" href="https://www.nature.com/articles/s41564-024-01856-x#ref-CR12" target="_top" class="ke-link">12</a>. Further research is needed to understand these mechanisms and to explore the relationship between gut physiology and microbiome under controlled diets, possibly involving dietitians or providing whole diets.</p><p>Despite its limited cohort size, our study shows significant associations between intestinal segmental transit time and pH with intra- and inter-individual differences in the gut microbiome composition and metabolism in a healthy population. Potential limitations to consider are the choice of breakfast made before the SmartPill measurement; given that past validation studies and their normative data rely on specific meal/nutrient combinations<a style="color: #006699;" href="https://www.nature.com/articles/s41564-024-01856-x#ref-CR52" target="_top" class="ke-link">52</a>,<a style="color: #006699;" href="https://www.nature.com/articles/s41564-024-01856-x#ref-CR53" target="_top" class="ke-link">53</a>, any deviations from these could likely influence gut motility and transit time. Furthermore, the sweet-corn test is not a validated tool to assess WGTT despite being cost effective. Finally, the introduction of corn and the meals during the first visit constitute small dietary changes, but they could possibly have impacted gut physiology. While this study included a rather homogenous group of healthy volunteers, it provides valuable insights into longitudinal variations in gut microbial metabolism and pH over more than 1 week. Our results highlight the important role of transit time and pH for the gut microbiome composition and levels of microbial-derived metabolites, emphasizing the importance of considering gut physiology and environment in human microbiome studies. This may be key for understanding the healthy gut microbiome and for disentangling personal microbiome responses to foods and other lifestyle factors.</p><p> </p><p style="text-align: start;">일일 섬유질 섭취량과</p><p style="text-align: start;">여러 단백질 분해 마커 사이의 음의 상관관계도 관찰되었다.</p><p style="text-align: start;"> </p><p style="text-align: start;">식이 섬유는</p><p style="text-align: start;">미생물 트립토판 대사를 조절할 수 있으므로<a style="color: #0070d1;" href="https://www.nature.com/articles/s41564-024-01856-x#ref-CR51" target="_top" class="ke-link"><u>51</u></a>,</p><p style="text-align: start;">결장에서 섬유질의 가용성은 건강에 부정적인 결과를 초래하는 미생물 단백질</p><p style="text-align: start;">발효에 영향을 미칠 수 있다<a style="color: #0070d1;" href="https://www.nature.com/articles/s41564-024-01856-x#ref-CR11" target="_top" class="ke-link"><u>11</u></a>,<a style="color: #0070d1;" href="https://www.nature.com/articles/s41564-024-01856-x#ref-CR12" target="_top" class="ke-link"><u>12</u></a>.</p><p style="text-align: start;"> </p><p style="text-align: start;">이러한 메커니즘을 이해하고</p><p style="text-align: start;">통제된 식이 조건 하에서 장 생리학과 미생물군집 간의 관계를 탐구하기 위해서는</p><p style="text-align: start;">영양사 참여 또는 전체 식이 제공을 포함한 추가 연구가 필요하다.</p><p style="text-align: start;"> </p><p style="text-align: start;">코호트 규모가 제한적임에도 불구하고,</p><p style="text-align: start;">본 연구는 건강한 인구 집단에서</p><p style="text-align: start;">장 구간 통과 시간 및 pH와 장내 미생물군집 구성 및 대사에서의 개인 내·간 차이에 대한 유의한 연관성을 보여줍니다.</p><p style="text-align: start;"> </p><p style="text-align: start;">고려해야 할 잠재적 한계로는</p><p style="text-align: start;">스마트필 측정 전 선택한 아침 식사가 있습니다.</p><p style="text-align: start;"> </p><p style="text-align: start;">과거 검증 연구 및 그 기준 데이터가 특정 식사/영양소 조합에 의존한다는 점을 감안할 때<a style="color: #0070d1;" href="https://www.nature.com/articles/s41564-024-01856-x#ref-CR52" target="_top" class="ke-link"><u>52</u></a>,<a style="color: #0070d1;" href="https://www.nature.com/articles/s41564-024-01856-x#ref-CR53" target="_top" class="ke-link"><u>53</u></a>,</p><p style="text-align: start;">이를 벗어난 경우 장 운동성과 통과 시간에 영향을 미칠 수 있습니다.</p><p style="text-align: start;"> </p><p style="text-align: start;">또한, 스위트콘 테스트는 비용 효율적임에도 불구하고 WGTT 평가를 위한 검증된 도구가 아닙니다. 마지막으로, 첫 방문 시 옥수수 및 식사 도입은 작은 식이 변화이지만 장 생리학에 영향을 미쳤을 가능성이 있습니다. 본 연구는 비교적 동질적인 건강한 자원자 집단을 포함했지만, 1주 이상에 걸친 장내 미생물 대사 및 pH의 종적 변동에 대한 귀중한 통찰력을 제공합니다. 본 연구 결과는 장내 미생물군 구성과 미생물 유래 대사산물 수준에 있어 통과 시간과 pH의 중요성을 부각시키며, 인간 미생물군 연구에서 장 생리학적 환경을 고려할 필요성을 강조한다. 이는 건강한 장내 미생물군을 이해하고, 식품 및 기타 생활습관 요인에 대한 개인별 미생물군 반응을 규명하는 데 핵심적일 수 있다.</p><p> </p><p>Methods</p><p>Study participants</p><p>A 9 day human observational trial (PRIMA, toward Personalized dietary Recommendations based on the Interaction between diet, Microbiome and Abiotic conditions in the gut) among healthy participants was conducted at the Department of Nutrition, Exercise and Sports at the University of Copenhagen in Denmark from April to December 2021. The research protocol was approved by the Municipal Ethical Committee of the Capital Region of Denmark (H-20074067), and all participants provided written informed consent to participate according to Case Report (CARE) guidelines and in compliance with the principles of the Declaration of Helsinki. The study was registered at ClinicalTrails.gov (ID <a style="color: #006699;" href="https://clinicaltrials.gov/ct2/show/NCT04804319" target="_top" class="ke-link">NCT04804319</a>).</p><p>Out of the initially anticipated 85 individuals, 63 healthy participants living in Denmark were enrolled, and 61 completed the study (43 women and 18 men; Extended Data Fig. <a style="color: #006699;" href="https://www.nature.com/articles/s41564-024-01856-x#Fig6" target="_top" class="ke-link">1</a>). The two drop-outs were excluded due to illness and antibiotic administration. Among the 61 study participants, a subset of 50 volunteers (37 women and 13 men) underwent wireless motility capsule monitoring at visit 1 as anticipated. Volunteers were compensated with gift cards (500 or 800 DKK) but received no direct financial compensation. The criteria for inclusion in the study specified for participants who were healthy by self-report (did not suffer from inflammatory bowel syndrome, small-intestinal overgrowth, inflammatory bowel disease, chronic or infectious disease, diabetes or cancer), ages 18–75 years old with a BMI between 18.5 and 29.9 kg m−2, with no intake of medication, except for mild antidepressants and contraceptive pills. Intake of antibiotics, diarrhoea inhibitors and laxatives 1 month before the trial was not allowed. Furthermore, pregnant or lactating women were not included in the trial.</p><p>The PRIMA study was an explorative study. The primary outcome was to investigate associations between faecal pH and gut microbial saccharolytic/proteolytic metabolism (assessed by targeted and untargeted metabolomics). The secondary outcomes included to explore relationships between the gut environmental factors (small-intestinal and colonic pH and transit time assessed by wireless motility capsules and various transit time proxy markers measured in faeces) and gut microbiome and metabolome assessed by 16S rRNA sequencing and metabolomics.</p><p>Experimental design and sample collection</p><p>Seven days before the study, the participants were asked not to consume any sweet corn as two self-administered sweet-corn tests to eval‎uate the WGTT were part of the study. Before both visits, the participants were asked to abstain from alcohol intake, smoking and strenuous exercise.</p><p>The participants were asked to maintain their habitual diet and register their food intake online via the Myfood24 tool (myfood24.org) with nutritional values based on the Danish food composition database FRIDA version 4.1 (frida.fooddata.dk) for eight consecutive days during the study. During the trial, the participants collected daily stool samples (first bowel movement whenever possible), stored the samples in their domestic freezers and transported them to the laboratory while being kept cold. Moreover, the participants self-reported daily their defecation patterns including time of defecations, stool consistency assessed by the BSS and stool frequency, intake of dietary supplements and medication (limited to pain killers for a few participants), and their gastrointestinal symptoms. The gastrointestinal symptoms were assessed based on a 10 cm visual analogue scale (0, no symptoms; 10, the most severe symptoms) in regard to stomach ache, bloating, constipation, diarrhoea and overall comfort. Women were asked to note down whether they had menstruation during the study period (yes/no). Furthermore, the participants collected seven daily spot morning urine samples (days 1, 2, 4, 5, 6, 7, 8; the first morning sample) and two 24 h urine samples (days 2–3 and days 8–9) during the study period. The collected urine samples were stored in the participants’ domestic freezers, transported to the study site in a cooling bag and stored at −20 °C overnight. After thawing at 5 °C, aliquots of 1 ml were taken and stored at −80 °C until further use. In addition, the participants consumed 100 g of sweet corn before their evening meal on days 3 and 5 and recorded the time of the corn egestion<a style="color: #006699;" href="https://www.nature.com/articles/s41564-024-01856-x#ref-CR23" target="_top" class="ke-link">23</a>.</p><p>At both visits (days 2 and 9), fasting blood and breath samples were collected. During the first visit, anthropometric measurements (height, body weight and BMI) were obtained. Furthermore, the first visit also included a standardized meal test for all participants (<i>n</i> = 61). The test meal consisted of rye bread (with butter and jam), a boiled egg, a portion of natural yoghurt along with nuts, walnuts, blueberries and a glass of water (100 ml) with 250 mg of dissolved paracetamol (Table <a style="color: #006699;" href="https://www.nature.com/articles/s41564-024-01856-x#MOESM1" target="_top" class="ke-link">S1</a>), which was used as a marker of postprandial gastric emptying of liquids<a style="color: #006699;" href="https://www.nature.com/articles/s41564-024-01856-x#ref-CR54" target="_top" class="ke-link">54</a>. The meal portion size was calculated as 25% of the daily energy demand of each participant based on the Harris–Benedict equation<a style="color: #006699;" href="https://www.nature.com/articles/s41564-024-01856-x#ref-CR22" target="_top" class="ke-link">22</a>. Postprandial urine samples (at 30 min, 60 min, 120 min, 180 min, 240 min, 300 min and 360 min and between 6 and 8 h, between 8 and 10 h and between 10 and 24 h) and postprandial breath exhalations (at 30 min, 60 min, 90 min, 120 min, 150 min, 180 min, 210 min, 240 min, 270 min, 300 min, 330 min and 360 min) were collected. A subset of participants (<i>n</i> = 50) ingested a SmartPill capsule immediately after the meal with a bit of additional water if needed. All participants drank 150 ml of water at 2 h and 4 h after the meal, respectively. At 6 h, all participants received a sandwich and 500 ml of water and left the study site.</p><p>SmartPill data collection and analysis</p><p>The SmartPill capsule is a single-use wireless gastrointestinal capsule (26.8 mm × 13 mm) that transmits data on luminal pH, temperature and pressure to a portable receiver, which was worn by the participants from ingestion to egestion and thereafter returned to the study personnel. The capsule measures a pH range of 1–9, with an accuracy of ±0.5 pH units, pressure at a range of 0–350 mmHg (±5 mmHg) and temperature ranging between 20 °C and 40 °C (±1 °C)<a style="color: #006699;" href="https://www.nature.com/articles/s41564-024-01856-x#ref-CR23" target="_top" class="ke-link">23</a>. Upon receiving the portable receiver, the study personnel downloaded the raw data from the receiver to the manufacturer’s software via a docking station (Motility GI v 3.1). Intestinal segmental transit times were determined based on landmark changes in the pH values as follows: gastric emptying was defined as the time point with an abrupt increase of ≥3 pH units indicating passage from the stomach into the duodenum. The passage from the small intestine into the ileocaecal junction was defined as the first time point with a decrease of at least one pH unit. The body exit of the capsule was defined as the time point with a decrease in temperature and/or a loss of data. The time of capsule residence in each of the gastrointestinal segments corresponds to GET, small-intestinal transit time, CTT and combined WGTT. Regional pH and pressure profiles were also obtained, and the median values were determined. The segmental transit time and pH values in the colon were further segmented into proximal, distal and recto-sigmoid, respectively. The proximal colon pH and transit time were estimated as median values of the first 32.3% of the total CTT, the distal colon pH were median values of the next 32.6% and the recto-sigmoid pH were median values of the last 35.4%; this was based on previously reported data, which determined the percentages of total CTT according to the location of radio-opaque markers (visualized by X-rays) in the different segments of the colon<a style="color: #006699;" href="https://www.nature.com/articles/s41564-024-01856-x#ref-CR16" target="_top" class="ke-link">16</a>. In addition, the median pH value measured during the last 10 min before the capsule egestion was registered as rectal pH.</p><p>Dietary records</p><p>Detailed 24 h weighted food intakes were recorded for 8 consecutive days by the participants via the online Myfood24 tool (myfood24.org) with nutritional values based on the Danish food composition database FRIDA version 4.1 (frida.fooddata.dk). The collected data included information about the intake of macronutrients (carbohydrate, protein, fat) and dietary fibre (AOACFIB), in addition to information about more than 80 nutrients. Under-reporting was identified by calculating the reported caloric intake divided by the average daily energy demand for each person with a cut-off value of 0.8 (ref. <a style="color: #006699;" href="https://www.nature.com/articles/s41564-024-01856-x#ref-CR55" target="_top" class="ke-link">55</a>). Accordingly, approximately 25% of the daily dietary records were under-reported, and the data were removed in the subsequent analyses in this study (this essentially affected 10 participants who under-reported more than 4 out of the 8 days, while the other participants occasionally under-reported daily intakes). By contrast, no over-reporters (cut-off >2.5) were detected. The total dietary profiles (all macro- and micronutrients available in Myfood24) were used in the principal component analysis, whereas macronutrient and fibre intake were used in the redundancy analyses. The daily intake was used for intra-individual analysis, whereas mean intake across the 8 days was used for the inter-individual analysis.</p><p>Breath exhalations measurements</p><p>Fasting and postprandial levels of hydrogen and methane were measured in all breath samples by the M.E.C. Lactotest 202 Xtend device (M.E.C. R&D sprl).</p><p>Biochemical analysis of blood</p><p>Blood samples were immediately put on ice upon collection until they were centrifuged for precipitation of blood cells and stored at −80 °C. Glucose was measured in plasma samples by using Pentra ABX 400 (HORIBA ABX) with a detection limit of 0.11 mmol l−1. Serum insulin and C-peptide levels were measured by using Immulite 2000 XPi (Siemens Healthcare Diagnostics) with the detection limit of 14.4 pmol l−1 and 27 pmol l−1, respectively. Before the analyses, both instruments’ performances were validated using external and internal insulin, c-peptide and glucose controls. Three participants arrived for the second visit in a postprandial state; the blood was collected and analysed accordingly, but the glucose, insulin and c-peptide values were not included in the data analysis.</p><p>Faecal measurements</p><p>Upon receipt, faecal samples were stored at −20 °C overnight, thawed and homogenized in sterile water with a sample-to-water ratio of 1:1 (<i>w</i>/<i>v</i>) (faecal slurry). Subsequently, pH was measured in the faecal slurry using a digital pH meter (Mettler Toledo). The homogenized samples were subsequently aliquoted to cryotubes and stored at −80 °C until further analyses. Stool moisture was determined by evaporating the water of one aliquot (approximately 1 ml) using a vacuum concentrator (Speed-Vac, Christ RVC 2-25) and by calculating the faecal weight difference before and after evaporation.</p><p>Faecal SCFAs and BCFAs were quantified by LC-MS in samples collected between day 2 and day 5 (<i>n</i> = 170) as previously described<a style="color: #006699;" href="https://www.nature.com/articles/s41564-024-01856-x#ref-CR32" target="_top" class="ke-link">32</a>. In brief, the samples were thawed, mixed with ethanol and purified by filtration (0.2 µm filter). Subsequently, the samples were derivatized with 3-nitrophenylhydrazine, and labelled internal SCFA standards were added. Dilution series of external SCFA standards were spiked with internal SCFA standards, and all derivatized samples were analysed on ultra-performance liquid chromatography (UPLC)-quadrupole time-of-flight mass spectrometry (QTOF-MS) (Synapt G2, Waters) in negative ionization mode (cone voltage 3.0 kV) with an ACQUITY BEH C18 guard column (2.1 × 5 mm, 1.7 µm, Waters) coupled to an ACQUITY BEH C18 column (2.1 × 100 mm, 1.7 µm, Waters) and with collision energy of 6.0 eV. The faecal concentrations of SCFAs and BCFAs were determined using vendor software (Quanlynx, Waters).</p><p>Bacterial load in faeces was determined using approximately 500 µl of frozen faecal slurry (238–816 mg) and diluting it 400,000 times in physiological saline (8.5 g l−1 NaCl; VWR International). Next, 1 ml of the microbial cell suspension obtained was stained with 1 μl SYBR Green I (1:100 dilution in dimethylsulfoxide; shaded during 20 min incubation at 37 °C; 10,000 concentrate, Thermo Fisher Scientific). The flow cytometry analysis of the bacterial cells present in the suspension was performed using a Cytoflex flow cytometer (CytoFLEX 3; Beckman) as previously described (Supplementary Fig. <a style="color: #006699;" href="https://www.nature.com/articles/s41564-024-01856-x#MOESM1" target="_top" class="ke-link">3</a>)<a style="color: #006699;" href="https://www.nature.com/articles/s41564-024-01856-x#ref-CR24" target="_top" class="ke-link">24</a>. The final microbial load was calculated per gram of faeces.</p><p>Microbiome profiling</p><p>DNA was extracted in random order from the faecal slurries (<i>n</i> = 484) using DNeasy PowerLyzer PowerSoil kit (Qiagen, 12855-100), and the V3 region of the 16S rRNA gene was PCR amplified using 0.2 µl Phusion High-Fidelity DNA polymerase (ThermoFisher Scientific, F-553L), 4 µl high-fidelity buffer, 0.4 µl dNTP (10 mM of each base), 1 µM forward primer (primer binding upstream); 5′-A-adapter-TCAG-barcode-CCTACGGGAGGCAGCAG-3′), 1 µM reverse primer (primer binding reverse); 5′-trP1-adapter-ATTACCGCGGCTGCTGG-3′) and 0.05–5 ng faecal DNA in 20 µl total reaction volume. Both primers (TAG Copenhagen A/S) were linked to sequencing adaptors, and the forward primer additionally contained a unique 10 bp barcode (Ion Xpress Barcode Adapters) for each sample. The PCR program consisted of an initial denaturation for 30 s at 98 °C, followed by 24 cycles of 98 °C for 15 s and 72 °C for 30 s and a final extension at 72 °C for 5 min. The PCR products were purified by the HighPrep PCR clean-up system (AC-60500 Magbio) according to the manufacturer’s protocol. The resulting DNA concentrations were determined by Qubit HS assay and libraries constructed with mixing equimolar amounts of each PCR product. Partial 16S rRNA gene sequencing was performed on an Ion S5 System (ThermoFisher Scientific) using OneTouch 2 Ion5: 520/530 kit-OT2 400 bp and an Ion 520 Chip. The raw data were pre-processed into an amplicon sequence variant (ASV) table using our in-house pipeline<a style="color: #006699;" href="https://www.nature.com/articles/s41564-024-01856-x#ref-CR56" target="_top" class="ke-link">56</a> based on the DADA2 algorithm and settings recommended for IonTorrent reads<a style="color: #006699;" href="https://www.nature.com/articles/s41564-024-01856-x#ref-CR57" target="_top" class="ke-link">57</a>, with taxonomy assigned to the ASVs using the Ribosomal Database Project (RDP, v18). The resulting ASV table, taxonomy and ASV sequences were merged into a phyloseq object for further analysis. For quantitative microbiome profiling analyses, the relative abundances derived from the pre-processed 16S rRNA sequencing analysis were adjusted for the bacterial loads as previously published<a style="color: #006699;" href="https://www.nature.com/articles/s41564-024-01856-x#ref-CR58" target="_top" class="ke-link">58</a>. In brief, samples with <10,000 reads were removed (<i>n</i> = 362) and downsized to even sampling depth, defined as the ratio between sample size (16S rRNA gene copy number corrected sequencing depth) and bacterial load. 16S rRNA gene copy numbers were retrieved from the rRNA operon copy number database rrnDB73 (ref. <a style="color: #006699;" href="https://www.nature.com/articles/s41564-024-01856-x#ref-CR59" target="_top" class="ke-link">59</a>). The copy-number-corrected sequencing depth of each sample was rarefied to the level necessary to equate the minimum observed sampling depth in the cohort while assuring a minimum number of 10,000 reads in each sample and optimizing the chosen sampling depth to exclude as few samples as possible. In case of no copy number correction, an average copy number of 3.88 was used<a style="color: #006699;" href="https://www.nature.com/articles/s41564-024-01856-x#ref-CR6" target="_top" class="ke-link">6</a>.</p><p>Metabolic profilingPreparation of urine and faecal samples</p><p>Untargeted urine and faecal metabolomics were performed as previously published<a style="color: #006699;" href="https://www.nature.com/articles/s41564-024-01856-x#ref-CR32" target="_top" class="ke-link">32</a>. All urine samples were thawed on ice, centrifuged at 10,000 <i>g</i> at 4 °C for 2 min and transferred to a new tube to remove solid particles. The urine samples were kept cold on ice during preparation. Samples were randomized and pipetted into 15 plates (96-well). All urine samples from the same individual were placed on the same 96-well plate. Subsequently, they were diluted to 1:5 with an internal standard mixture (l-adenine-8-13C (Cambridge Isotope Lab), l-phenyl-d5-alanine-2,3,3-d3 (Cambridge Isotope Lab), caffeic acid 13C3 (Toronto Research Chemicals), caffeine 13C3 (Toronto Research Chemicals), l-tyrosine 13C9 (Sigma Aldrich), <i>para</i>-aminobenzoic acid (Sigma Aldrich), l-tryptophan-(indole-d5) (Sigma Aldrich), hippuric acid-[13C6] (IsoSciences), cortisone-d8 (Sigma Aldrich) and glycocholic acid-[2H4] (IsoSciences)). Quality control (QC) samples were obtained by mixing 20 µl of each urine sample in each plate (plate pools) and by mixing 20 µl of each plate pool to create the global pool. The QC samples, blank assays (0.1% formic acid) and mixtures of known standards (including 33 microbial-derived compounds) were included in each plate. The plates were sealed and stored at 4 °C until analysis (24 h maximum, otherwise stored at −80 °C). If the plate was frozen and thawed again before analysis, the plate was gently mixed by vortex stirring for 30 min immediately before analysis.</p><p>Faecal homogenates collected between day 2 and day 5 (<i>n</i> = 170) were thawed at room temperature for 30 min and vortexed. Approximately 50 ±5 mg (≈50 µl) of the homogenates were mixed with 96% ethanol and internal standard mixture (l-adenine-8-13C (Cambridge Isotope Lab), l-phenyl-d5-alanine-2,3,3-d3 (Cambridge Isotope Lab), caffeic acid 13C3 (Toronto Research Chemicals), caffeine 13C3 (Toronto Research Chemicals), l-tyrosine 13C9 (Sigma Aldrich), lysophosphatidylcholine (17:1d7) (Avanti Polar Lipids), l-tryptophan-(indole-d5) (Sigma Aldrich), hippuric acid-[13C6] (IsoSciences), cortisone-d8 (Sigma Aldrich) and glycocholic acid-[2H4] (IsoSciences)) resulting in a 1:60 dilution. The diluted samples were vortexed for 30 s and subsequently mixed at 60 °C for 2 min in a Thermo mixer at 1,400 r.p.m., before being centrifuged at 20,000 <i>g</i> (Eppendorf centrifuge 5417R) at 4 °C for 2 min. The supernatants were filtered through a 0.2 µm filter, and 200 µl of each faecal suspension was transferred to a 96-well plate, evaporated using a cooled vacuum centrifuge and re-dissolved in 200 µl 0.1% formic acid before the UPLC-MS. All faecal samples from the same individual were placed on the same 96-well plate, and QC samples were prepared in the same way as for the urine samples. In addition, each 96-well plate contained blank assays (96% ethanol) and mixtures of known standards (including 33 microbial-derived compounds).</p><p>UPLC-electrospray ionization-QTOF-MS analysis</p><p>Both urine and faecal samples were profiled by UPLC coupled with a QTOF mass spectrometer equipped with electrospray ionization (Synapt G2, Waters) in both positive and negative ionization modes<a style="color: #006699;" href="https://www.nature.com/articles/s41564-024-01856-x#ref-CR32" target="_top" class="ke-link">32</a>. Blank samples (0.1% formic acid), assay blanks, standard mixtures and QC samples were injected regularly to eval‎uate LC-MS system stability, possible contamination and/or loss of metabolites. The injected samples (5 µl) were separated on a reversed-phase column (ACQUITY HSS T3 C18 column, 2.1 × 100 mm, 1.8 µm) coupled with a pre-column (ACQUITY VanGuard HSS T3 C18 column, 2.1 × 5 mm, 1.8 µm). The mobile phases consisted of 0.1% formic acid in water (solvent A) and 0.1% formic acid in 70:30 acetonitrile/methanol (solvent B). The duration of the analytical run was 7 min with the following flow rate: start condition (0.5 ml min−1), 1 min (0.5 ml min−1), 2 min (0.6 ml min−1), 3 min (0.7 ml min−1), 4 min (0.8 ml min−1), 4.5 min (1.0 ml min−1), 6.4 min (1.1 ml min−1), 6.6 min (1.0 ml min−1), 6.8 min (0.5 ml min−1), 7.0 min (0.5 ml min−1), and the following gradient: start condition (5% B), 1 min (8% B), 2 min (15% B), 3 min (40% B), 4 min (70% B), 4.5 min (100% B), 6.6 min (5% B) and 7 min (5% B). Mass spectrometry data were acquired in full scan mode with a scan range of 50–1,000 mass/charge (<i>m</i>/<i>z</i>). Data-dependent acquisition was performed on the top three most abundant ions on QC samples (only urine) to provide MS2 data. Electrospray settings were the following: the cone voltage was 2.5 kV and 3.2 kV; the collision energy was 6.0 and 4.0 eV; and the temperature of the ion source and desolvation nitrogen gas temperature were 120 °C and 400 °C for positive and negative ionization mode, respectively.</p><p>Metabolomics data processing</p><p>The raw data obtained by UPLC-MS were converted to mzML format by publicly available msConvert (ProteoWizard Toolkit)<a style="color: #006699;" href="https://www.nature.com/articles/s41564-024-01856-x#ref-CR60" target="_top" class="ke-link">60</a>. The converted data were pre-processed using the open-source R package XCMS (v3.18) using the centWave algorithm (requiring three consecutive scans with an intensity of over ten counts)<a style="color: #006699;" href="https://www.nature.com/articles/s41564-024-01856-x#ref-CR61" target="_top" class="ke-link">61</a>. The pre-processing steps included noise filtering, peak picking, retention time alignment and feature grouping across samples, and filling of missing features, which were done separately for the urine and faecal samples (and for positive and negative mode), respectively. The detailed pre-processing parameter settings can be found in Supplementary Table <a style="color: #006699;" href="https://www.nature.com/articles/s41564-024-01856-x#MOESM1" target="_top" class="ke-link">9</a>. Noise filtering settings included that features should be detected in a minimum of 10% of all samples. Features with a retention time below 0.5 min or above 6.8 min were excluded. Data tables were generated comprising mass-to-charge ratio (<i>m</i>/<i>z</i>), retention time (rt) and intensity (peak area) for each variable in every sample. Each detected peak is represented by a feature defined by a rt and a <i>m</i>/<i>z</i>. The obtained data were corrected for within- and between-batch intensity drift using the locally estimated scatterplot smoothing correction method<a style="color: #006699;" href="https://www.nature.com/articles/s41564-024-01856-x#ref-CR62" target="_top" class="ke-link">62</a>. The processed data were normalized by the probabilistic quotient normalization<a style="color: #006699;" href="https://www.nature.com/articles/s41564-024-01856-x#ref-CR63" target="_top" class="ke-link">63</a> method to correct for variations in urine and faecal concentrations within and between batches. Upon analyses of 15 plates with urine samples, QC samples clustered closely together in the principal component analysis score plots, confirm‎ing a stable UPLC system during the course of analysis with the exception of two plates in the negative mode and one plate in the positive mode, which had to be removed from further statistical analyses (Supplementary Fig. <a style="color: #006699;" href="https://www.nature.com/articles/s41564-024-01856-x#MOESM1" target="_top" class="ke-link">4</a>).</p><p>Moreover, features with high variability after normalization across the pooled QC samples were filtered out (coefficient of variation, CV% >50%). Finally, the CAMERA package<a style="color: #006699;" href="https://www.nature.com/articles/s41564-024-01856-x#ref-CR64" target="_top" class="ke-link">64</a> (v1.52) was used to group features together based on retention time (tolerance = 0.1 s) and to annotate possible adducts and isotopes. Upon pre-processing, 641 and 651 molecular features were detected in the urine in positive and negative modes, respectively, whereas 453 and 445 molecular features were detected in faeces in positive and negative modes, respectively. MzMine 3 (ref. <a style="color: #006699;" href="https://www.nature.com/articles/s41564-024-01856-x#ref-CR65" target="_top" class="ke-link">65</a>) and MassLynx (Waters) were used for data visualization.</p><p>Metabolite identification and structure elucidation</p><p>MS2 analyses were performed by an ultra-high performance LC system coupled to a Vion IMS QTOF mass spectrometer (Waters) for obtaining spectra with higher mass accuracy. The samples were separated on a reversed-phase column (ACQUITY HSS T3 C18 column, 2.1 × 100 mm, 1.8 µm) coupled with a pre-column (ACQUITY VanGuard HSS T3 C18 column, 2.1 × 5 mm, 1.8 µm) at a temperature of 50 °C. The mobile phases consisted of 0.1% formic acid in water (solvent A), methanol (solvent B), 0.1% formic acid in 70:30 acetonitrile/methanol (solvent C) and isopropanol (solvent D). The duration of the analytical run was 10 min with the following flow rate: start condition (0.4 ml min−1), 0.75 min (0.4 ml min−1), 6 min (0.5 ml min−1), 6.5 min (0.5 ml min−1), 8 min (0.6 ml min−1), 8.1 min (0.4 ml min−1), 9 min (0.4 mlmin−1), 10 min (0.4 ml min−1), and the following gradient: start condition (100% A), 0.75 min (100% A), 6 min (100% B), 6.5 min (70% C, 30% D), 8 min (70% C, 30% D), 8.1 min (70% C, 30% D), 9 min (100% A) and 10 min (100% A). Full scan acquisition was performed on selected urine samples with a scan range of 50–1,500 <i>m</i>/<i>z</i>. Data-dependent acquisition was performed on a selected list of precursors at three different collision dissociation energies, 10, 30 and 50 eV.</p><p>Mass spectra were manually interpreted, and metabolites were identified by matching the precursor ion and fragmentation patterns with databases such as Human Metabolome Database (<a href="https://hmdb.ca/" target="_top" class="ke-link">https://hmdb.ca/</a>), Metlin (<a href="https://metlin.scripps.edu/" target="_top" class="ke-link">https://metlin.scripps.edu/</a>), mzCloud (<a href="https://www.mzcloud.org/" target="_top" class="ke-link">https://www.mzcloud.org/</a>), combinatorial database of bile acid conjugates<a style="color: #006699;" href="https://www.nature.com/articles/s41564-024-01856-x#ref-CR66" target="_top" class="ke-link">66</a> (<a href="http://melolab.org/smilib/" target="_top" class="ke-link">http://melolab.org/smilib/</a>) and an in-house database (<a href="https://gitlab.com/stanstrup_R_packages/mscurate" target="_top" class="ke-link">https://gitlab.com/stanstrup_R_packages/mscurate</a> and <a href="https://gitlab.com/stanstrup_R_packages/xcms-annotator" target="_top" class="ke-link">https://gitlab.com/stanstrup_R_packages/xcms-annotator</a>). In addition, we used several software annotations including GNPS (v30)<a style="color: #006699;" href="https://www.nature.com/articles/s41564-024-01856-x#ref-CR67" target="_top" class="ke-link">67</a> (<a href="https://gnps.ucsd.edu/" target="_top" class="ke-link">https://gnps.ucsd.edu/</a>), microbeMASST (v2024.08.26)<a style="color: #006699;" href="https://www.nature.com/articles/s41564-024-01856-x#ref-CR68" target="_top" class="ke-link">68</a> (<a href="https://masst.gnps2.org/microbemasst/" target="_top" class="ke-link">https://masst.gnps2.org/microbemasst/</a>) and SIRIUS (v6.0.5)<a style="color: #006699;" href="https://www.nature.com/articles/s41564-024-01856-x#ref-CR69" target="_top" class="ke-link">69</a> (<a href="https://bio.informatik.uni-jena.de/software/sirius/" target="_top" class="ke-link">https://bio.informatik.uni-jena.de/software/sirius/</a>), without obtaining additional plausible matches. Furthermore, authentic standards were run together with the samples with the highest intensity on the same batch and platform. If needed, the authentic standards were sulfated or glucuronidated with either biomimetic synthesis<a style="color: #006699;" href="https://www.nature.com/articles/s41564-024-01856-x#ref-CR70" target="_top" class="ke-link">70</a> or chemical synthesis<a style="color: #006699;" href="https://www.nature.com/articles/s41564-024-01856-x#ref-CR32" target="_top" class="ke-link">32</a>. The identification level of metabolites that were identified was classified according to Sumner et al.<a style="color: #006699;" href="https://www.nature.com/articles/s41564-024-01856-x#ref-CR71" target="_top" class="ke-link">71</a> as level I (confirmed by matching to a standard with two orthogonal measures (rt, <i>m</i>/<i>z</i>), level II (matching MS2 fragmentation to a spectral library), level III (compound classification) or level IV (unknown)<a style="color: #006699;" href="https://www.nature.com/articles/s41564-024-01856-x#ref-CR25" target="_top" class="ke-link">25</a>. See Supplementary Tables <a style="color: #006699;" href="https://www.nature.com/articles/s41564-024-01856-x#MOESM1" target="_top" class="ke-link">7</a> and <a style="color: #006699;" href="https://www.nature.com/articles/s41564-024-01856-x#MOESM1" target="_top" class="ke-link">8</a> for further details. 3-Hydroxy-2-oxindole, 5-hydroxyoxindole, 2-picolinic acid, 4-methylcatechol, xanthine, 2-oxindole-3-acetic acid, pantothenic acid, nicotinic acid, tryptophan, sebacic acid, pipecolic acid, glutaric acid, citric acid, psedouridine, taurine, 1,3-dimethyluric acid, suberic acid and 1,3,7-trimethyluric acid were purchased from Sigma-Aldrich. 4-Hydroxyhippuric acid, 1-methylxanthine and 1-methyluric acid were purchased from Toronto Research Chemicals.</p><p>Statistical analysis</p><p>Statistical analyses were conducted in R (v 4.2). The area under the curves for hydrogen and methane concentrations during the postprandial period was calculated using the trapezoid rule in GraphPad Prism (v 9.2.0). The normality of data was assessed with the Gaussian distribution and Shapiro–Wilk test procedure.</p><p>Mixed-effects linear regression models were used to examine the day-to-day fluctuations and inter-individual variation in gut environmental factors using data from all 9 days. The models were generated using the <i>lme4</i> R package (v 1.1-31) as lmer (gut environmental factor ~ factor(day) + (1 | Participant ID)); moreover, ranova function from the <i>lmerTest</i> package (v 3.1-3) was used to perform the random effects-likelihood ratio tests to infer whether Participant ID significantly contributes to explaining the variation in the gut environmental factors. <i>P</i> value of < 0.05 was considered statistically significant. Coefficients of intra-individual variation were calculated as CVIntra = (s.d.intra/Meanintra) × 100 where mean and s.d. were based on all measurements from a single individual over the 9 days.</p><p>Gut microbiome beta-diversity analysis using Bray–Curtis distances as well as metabolome and diet beta-diversity analyses using Euclidian distances were performed with the <i>phyloseq</i> package (v 1.42.0) and PERMANOVA tests by adonis2 function from the <i>vegan</i> package (v 2.6) with 999 permutations and strata = Participant ID when testing the day-to-day fluctuations.</p><p>Single time point correlations were calculated using standard Spearman’s rank correlation, as implemented in the <i>Hmisc</i> R package (v 4.7), and heat maps were generated by the <i>corrplot</i> package (v0.92). Repeated measure correlations were performed using the <i>rmcorr</i> (v 0.5)<a style="color: #006699;" href="https://www.nature.com/articles/s41564-024-01856-x#ref-CR72" target="_top" class="ke-link">72</a>.</p><p>db-RDA was performed to quantify the effect sizes of gut environmental factors and other variables on the intra-individual and inter-individual variation in the gut microbiome (both relative and quantitative profiles at genus level) and faecal and urine metabolomes (untargeted data, all features). The analyses were performed with Bray–Curtis dissimilarity using the <i>capscale</i> function as implemented in the <i>vegan</i> package (v 2.6). With regards to intra-individual analyses, data available from all samples (day 1 to day 9) and <i>strata</i> = Participant ID were used. For the inter-individual analyses, data collected on day 2 (visit 1) were used separately for all participants (<i>n</i> = 61) and for the SmartPill subgroup (<i>n</i> = 50). The statistical significance was determined by permutation test with 9,999 random permutations (<i>anova.cca</i> function), and <i>P</i> values were adjusted for multiple testing by false discovery rate (Benjamin–Hochberg)<a style="color: #006699;" href="https://www.nature.com/articles/s41564-024-01856-x#ref-CR73" target="_top" class="ke-link">73</a>. An adjusted <i>P</i> value (<i>q</i> value) below 0.1 was considered significant.</p><p>For the untargeted metabolomics data, the area of each <i>m</i>/<i>z</i> feature was log-transformed, and missing values were imputed and replaced by values reflecting half of the minimum intensity of the given <i>m</i>/<i>z</i> feature. Linear regression models and SPLS models were performed to examine the relationship between the <i>m</i>/<i>z</i> features and the variables of interest (that is, segmental transit time and pH). The modelling was performed using the SmartPill-derived data and the 24 h postprandial urine metabolome collected at day 2 as well as the faecal metabolome closest to the time of the SmartPill egestion. The linear mixed models were performed with the <i>lme4</i> R package (v 1.1-31). The multivariate SPLS models were performed with the <i>caret</i> R package (v 6.0-92). <i>P</i> values were corrected for multiple testing by the Benjamin–Hochberg false discovery rate (<i>q</i> value). Features with <i>q</i> < 0.1 were considered to be statistically significant, and only features selected by both the linear regression and SPLS were further submitted for identification including the MS2.</p><p>Reporting summary</p><p>Further information on research design is available in the <a style="color: #006699;" href="https://www.nature.com/articles/s41564-024-01856-x#MOESM2" target="_top" class="ke-link">Nature Portfolio Reporting Summary</a> linked to this article.</p><p>Data availability</p><p>All sequencing data have been submitted to the National Center for Biotechnology Information Sequence Read Archive. BioProject ID, <a style="color: #006699;" href="https://www.ncbi.nlm.nih.gov/bioproject/?term=PRJNA1044006" target="_top" class="ke-link">PRJNA1044006</a>. MS2 data of global urine and faecal pool samples are deposited at MassIVE <a style="color: #006699;" href="https://massive.ucsd.edu/ProteoSAFe/QueryMSV?id=MSV000095466" target="_top" class="ke-link">MSV000095466</a>. Individual-level personally identifiable MS2 data from the participants cannot be made freely available to protect the privacy of the participants, in accordance with the Danish Data Protection Act and European Regulation 2016/679 of the European Parliament and of the council (GDPR) that prohibits open distribution even in pseudoanonymized form. Metabolomics data and data tables can be shared upon request. For data inquiries, please contact the principal investigator, H.M.R., via email. Access will be eval‎uated and granted upon signing a data processing agreement between the governing legal entities. <a style="color: #006699;" href="https://www.nature.com/articles/s41564-024-01856-x#Sec30" target="_top" class="ke-link">Source data</a> are provided with this paper.</p><p>Code availability</p><p>No custom code was generated for this work.</p><p>References</p><ol style="list-style-type: decimal;" data-ke-list-type="decimal"><li> </li><li> </li><li> </li><li> </li><li> </li><li> </li><li> </li><li> </li><li> </li><li> </li><li> </li><li> </li><li> </li></ol>
<!-- -->